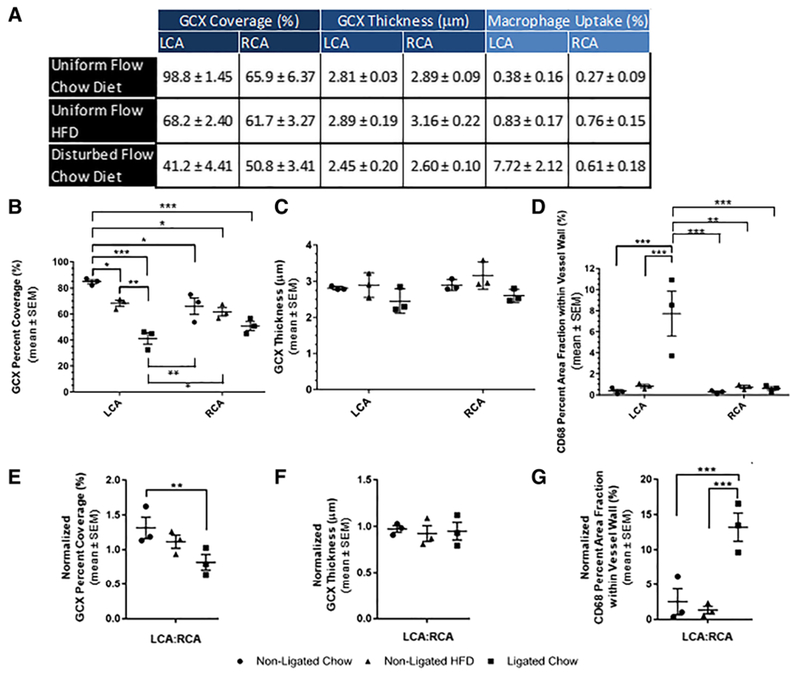
Fig. 6.

a Table shows the mean ± SEM GCX (Fig. 4) and macrophage infiltration (Fig. 5) data that was calculated from each cohort (which each include N = 3). b GCX coverage of inner vessel walls (LCA and RCA). c GCX thickness on inner vesselwalls (LCA and RCA). d Macrophage infiltration within LCA and RCA vessel walls. e Normalized GCX coverage of inner LCA walls (LCA:RCA). f Normalized GCX thickness on inner LCA walls (LCA:RCA). g Normalized macrophage infiltration within LCA vessel walls (LCA:RCA). b-g Each data point on graphs represents the mean for individual ApoE-KO mice in each group, where each group had N = 3 mice. For each condition, the mean along with error bars indicating SEM, for all animals taken together, is also shown. Statistical significance was assessed by a 2-way ANOVA and is indicated by asterisks as follows: *p < 0.05, **p < 0.01, ***p < 0.001, and ****p < 0.0001
