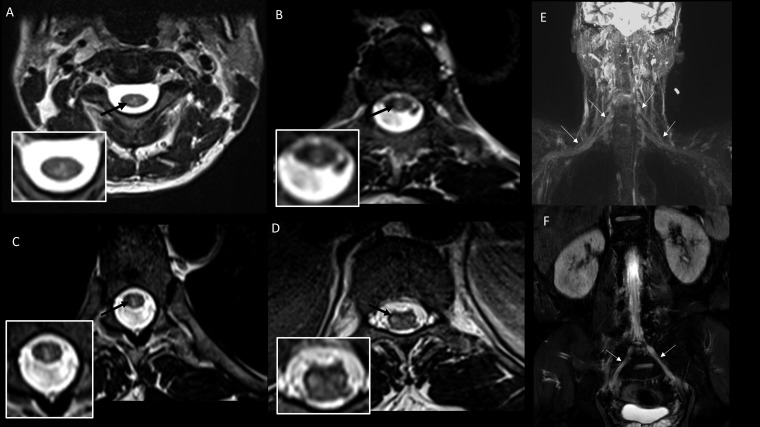
Figure 10.
Case 8: (A–D) Sequential axial T2-weighted images with corresponding reference images of the spine showing hyperintense lesions predominantly involving the central gray matter of the cord at the C2–C3 (A-inset), D4–D5 (B-inset), and D7–D8 (C-inset) levels with hyperintense lesions also seen in the conus medullaris at the D11–D12 level (D-inset). (E) Maximum intensity projection (MIP) image constructed from T2 sampling perfection with application optimized contrasts using different flip angle evolution (SPACE) coronal sequence with fat-sat shows thickening and hyperintensity in the cords, divisions, and trunks of bilateral brachial plexus; (F) MIP image from T2 SPACE coronal sequence shows thickening and hyperintensity of the lumbosacral plexus.

