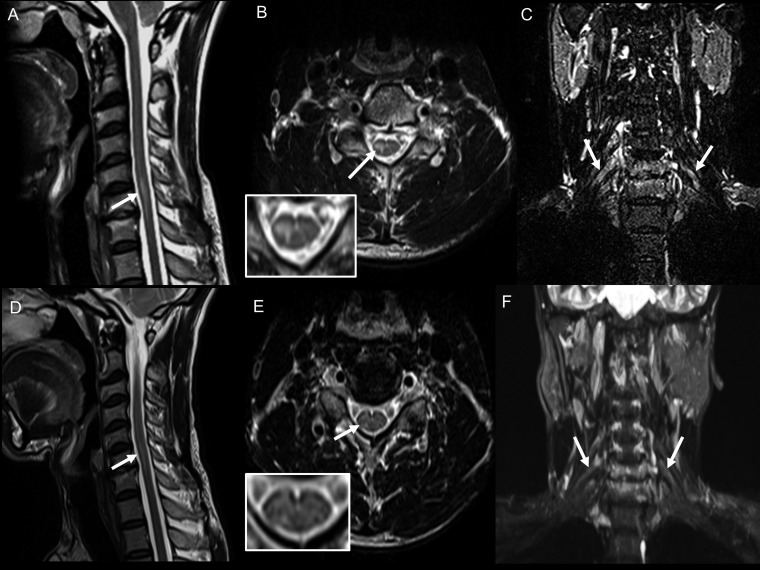
Figure 6.
Case 4: Pretreatment magnetic resonance imaging (MRI) images: (A) T2W sagittal image showing linear hyperintensity in the cervical cord at C6 and C7 levels; (B) axial image at C6 shows right hemicord hyperintensity (inset); (C) coronal short inversion time inversion recovery (STIR) image shows thickening of bilateral brachial plexus roots (right > left). Posttreatment MRI images: (D) T2 sagittal image of cervical spine shows that linear hyperintensity in the cervical cord at the C6 and C7 levels has decreased as compared with the pretreatment image; (E) T2-weighted axial image at the C6 level shows a decrease in the signal change in the right hemicord (inset); (F) coronal STIR image shows decrease in the thickening of brachial plexus roots as compared with the pretreatment image.

