Figure 7.
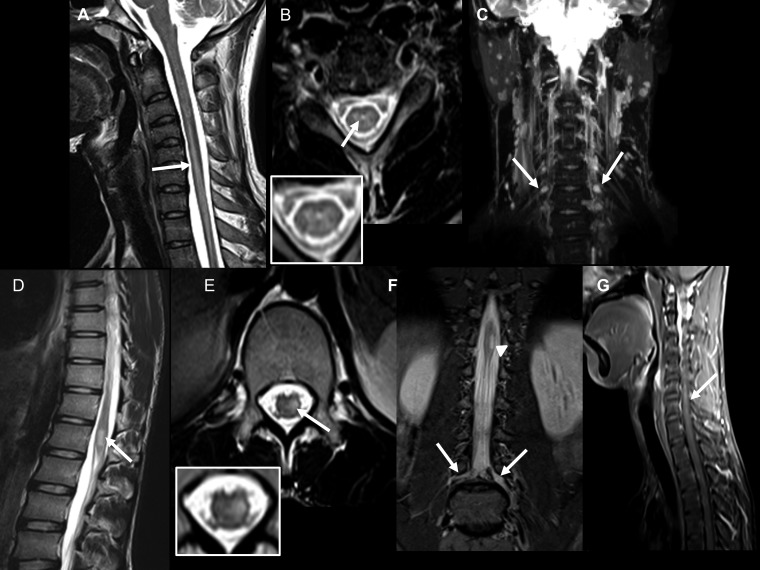
Case 5: (A) T2 sagittal image of the cervical spine shows a long-segment signal change in the cord from the C4 to D2 levels. (B) T2 axial image at the C6 vertebral level shows hyperintensity in the central cord (inset). (C) Maximum intensity projection image of coronal short inversion time inversion recovery (STIR) of the cervical spine shows mild bilateral symmetrical thickening of the brachial plexus nerve roots. Case 6: (D) T2-weighted sagittal image of the lumbar spine showing linear hyperintensity at the conus. (E) T2-weighted axial image at the level of the conus showing hyperintensity located in the left hemicord (inset). (F) Coronal STIR images of the lumbar spine showing hyperintensity at the conus (arrowhead) with thickening of bilateral lumbar plexus nerve roots (left > right). Case 7: (G) T1-weighted post-contrast fat-suppressed left parasagittal image showing linear enhancing lesion at the C5–C6 level.

