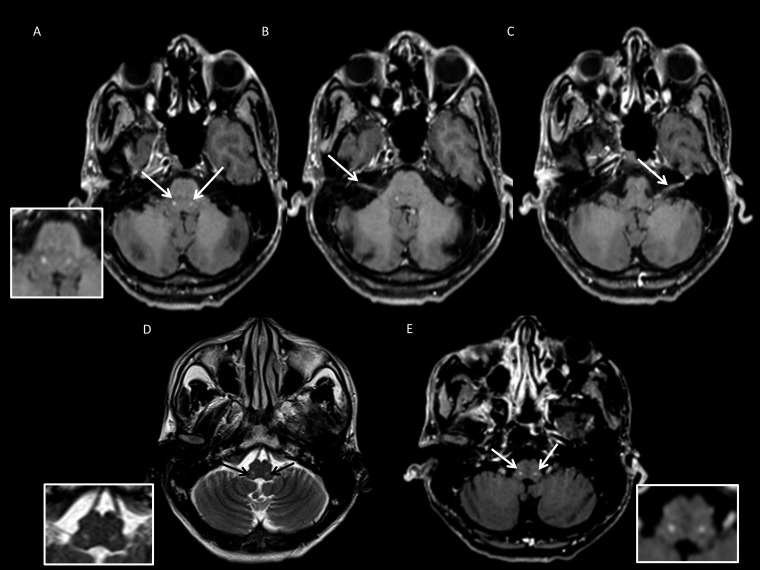
Figure 9.
Magnetic resonance imaging images. (A–C) Post-contrast axial T1-weighted images show enhancement in the region of the facial nucleus bilaterally (A-inset), right (B) and left (C) facial nerve. (D and E) Axial T2 image at the level of the medulla showing discrete focal hyperintensity in the region of bilateral nucleus ambiguus (D-inset), with focal enhancement on post-contrast axial T1 (E-inset).

