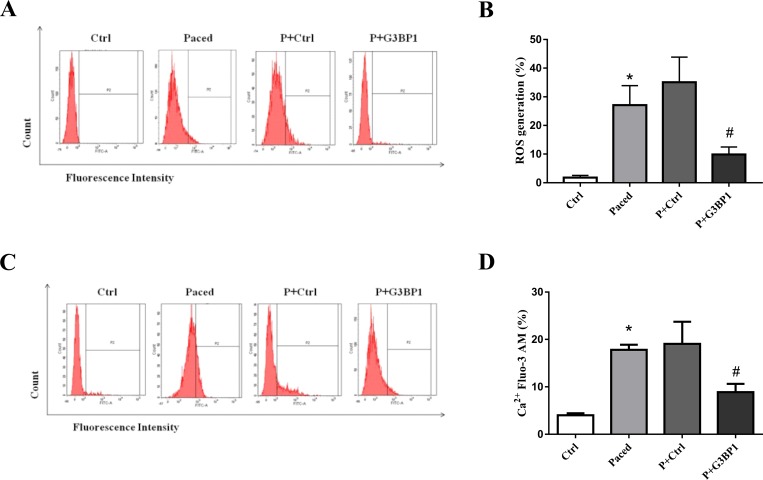
Fig 3. Effect of exogenous G3BP1 on ROS production and calcium overload in the paced stable HL-1 cell line.
Flow cytometry was used to analyze the level of ROS (A) and the amount of Ca2+ (C) in HL-1 cells, n = 6. (B,D) Quantification of relative ROS and Ca2+ levels; n = 6. Data are expressed as the mean ± SEM. Ctrl: HL-1 cells; Paced: HL-1 cells paced for 6 h; P+Ctrl: cell lines stably expressing control plasmid that were paced for 6 h; and P+G3BP1: cell lines stably expressing G3BP1 that were paced for 6 h. *P < 0.01 compared with the Ctrl group; # P < 0.05 compared with the P+Ctrl group.

