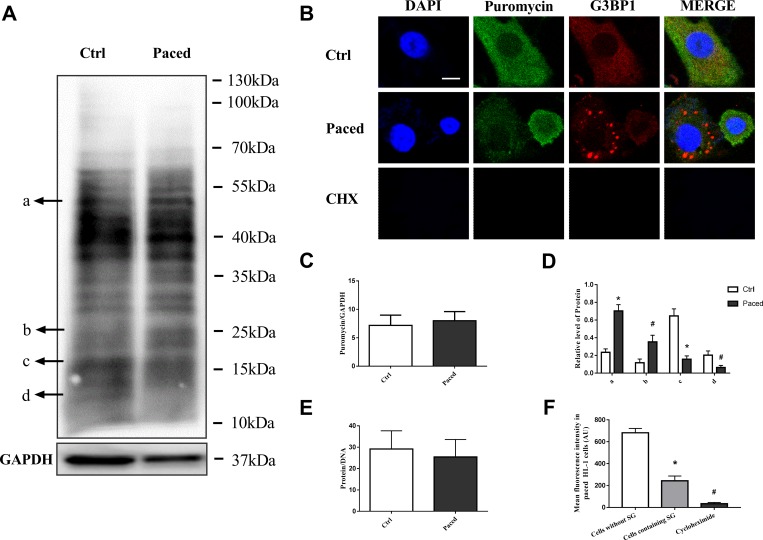
Fig 5. Protein synthesis in paced HL-1 cells.
A, Puromycin was incorporated into HL-1 cells and proteins were detected by western blot. B, Puromycin was incorporated into HL-1 cells and protein synthesis in single cells was analyzed by immunofluorescence. Puromycin was indicated by green fluorescence and G3BP1 was indicated by red fluorescence signals. C,D The amount of protein is expressed as the mean ± SEM (n = 6). *P < 0.01 compared with the control group; #P < 0.05 compared with the control group. E, The ratio of protein to DNA (n = 6). F, Mean fluorescence intensity in HL-1 cells was shown as mean ± SEM (n = 6). *P < 0.01 compared with the cells without SG, #P < 0.01 compared with the cells containing SG.

