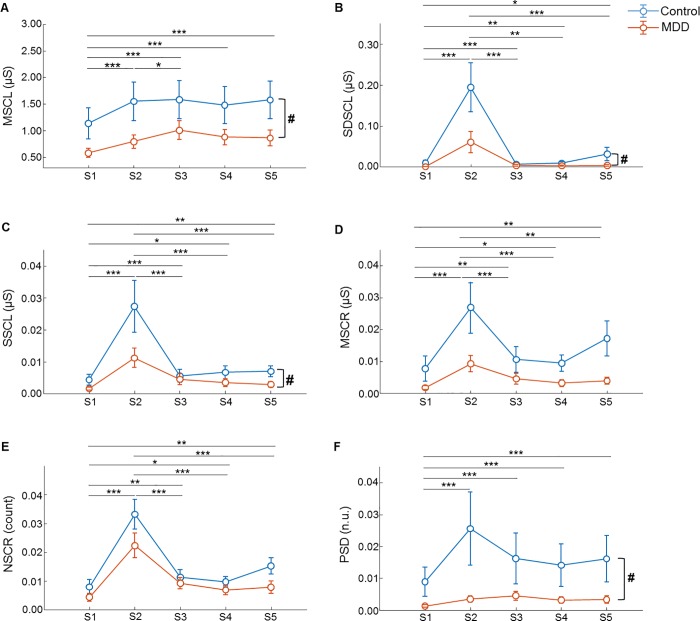
Fig 3.
Mean ± SE of (A) MSCL, (B) SDSCL, (C) SSCL, (D) MSCR, (E) NSCR, and (F) PSD. Effects of group and task on the (A)-(F) features of the MDD patients (N = 30) and the healthy controls (N = 31) were analyzed using the non-parametric equivalent of a repeated-measures ANOVA (#p < 0.05). Post-hoc comparisons of tasks were corrected using the Bonferroni method (*p < 0.05, **p < 0.01, ***p < 0.001).

