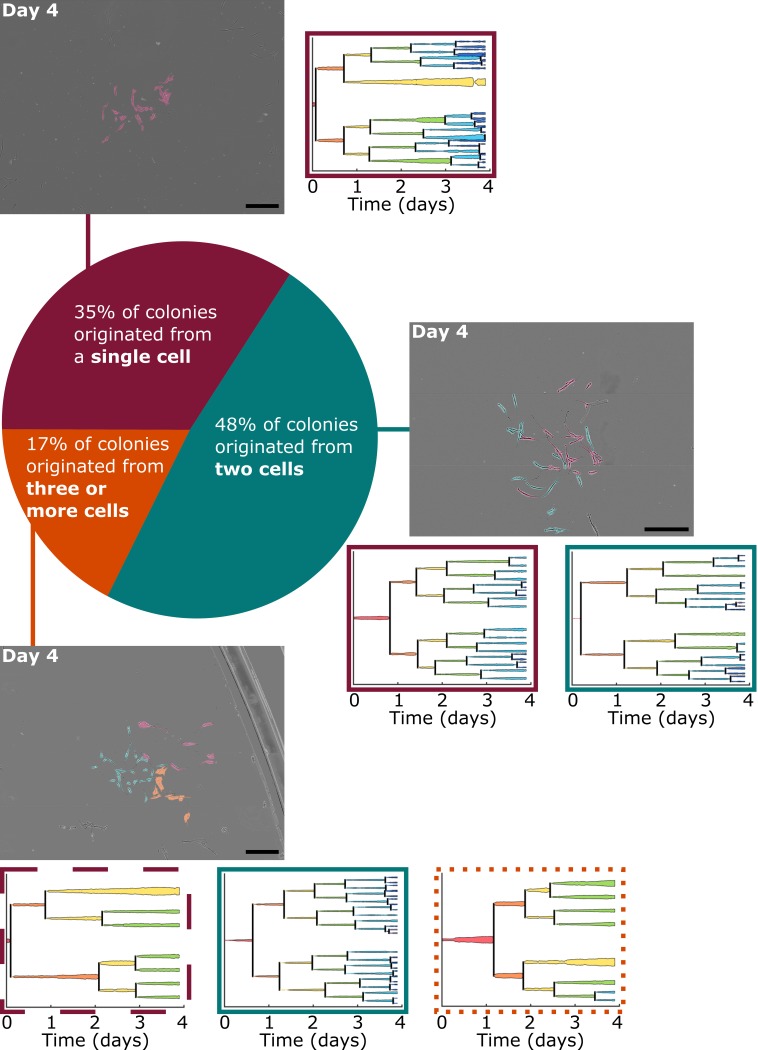
Fig 1. Colonies observed after four days of growth varied by the number of originating progenies.
Of all locations in which colony formation was observed, approximately 35% originated from a single tracked cell, 48% originated from two analyzed cells, and the remainder formed from three or four originating cells that attached near each other at the start of the experiment. Phase contrast images of three representative colonies after four days of growth are displayed, organized by the number of analyzed cells the colonies originated from. Images are montages of nine or sixteen fields of view and were altered post-experiment to artificially color the BMSCs by the progeny they belong to. Cells without color added are BMSCs that migrated into the montaged field of view after initial imaging. Lineage trees of the colonies’ originating cells are also presented, where the width of the lineage lines is representative of the respective cell spread area at each 15 min time point. Lineage trees and images of all colonies at several time points are presented in S1 Fig. Lineage tree outlines indicate the proliferative capacity of the progeny. Dashed line (- -): progeny classified as slow proliferator; dotted line (…): progeny classified as moderate proliferator; solid line (–): progeny classified as fast proliferator. Scale bars = 0.5 mm.

