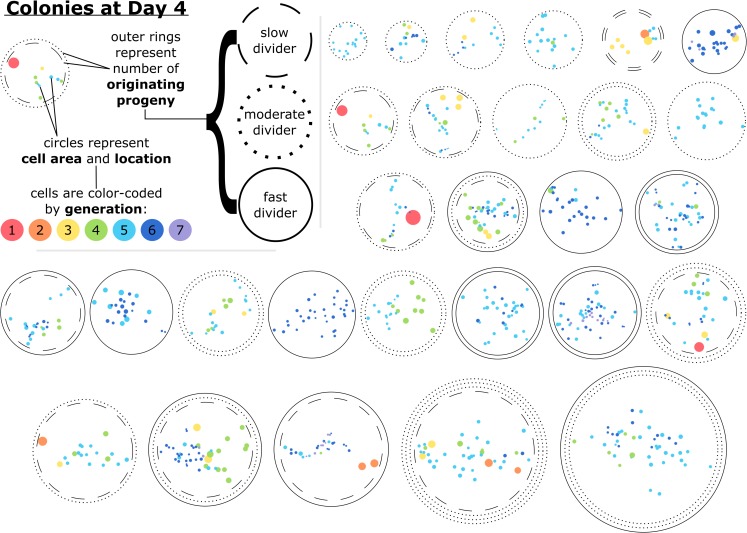
Fig 4. Cells within a colony after four days of growth varied by their size, generation, proximity to other cells, and the proliferative capacity of the progeny they belonged to.
Glyphs representative of each colony studied at the single-cell level at Day 4 are presented. Cells are represented by filled circles, which are color-coded by generation and oriented based on the coordinates of the final time point of the single-cell time lapse image analysis. Similarly, the spread area of each cell is represented by the size of the color-filled circles. The outer rings of each colony represent the number and proliferative capacity of the originating progeny; slow dividers had less than three population doublings and fast dividers had more than four population doublings by Day 4. The example provided in the upper-left-hand corner is a representation of a colony after four days of development that originated from two cells, one of which proliferated slowly and one that proliferated moderately. This example colony had 10 cells at Day 4 ranging from first to fifth generation, with the first generation cell being relatively isolated and having a large spread area. The colonies are ordered horizontally by their approximate diameter.

