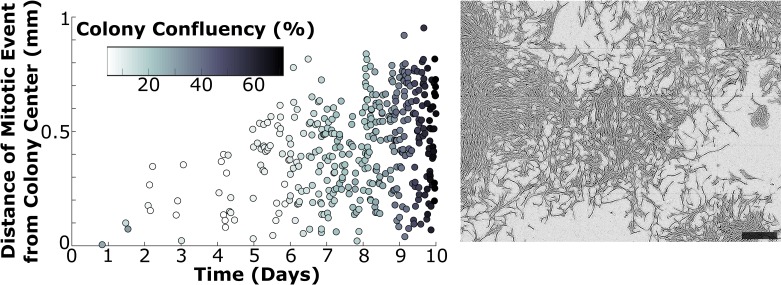
Fig 6. Proliferation continues to occur within confluent colonies.
The time and location of each cell division–as well as colony confluency–was measured for the first ten days of colony development in one colony. Mitotic events are reported in terms of their location relative to the colony center at each time point, and the shade of the data points is representative of the measured colony confluency (left). Cells continued to proliferate even at the center of the confluent colony after ten days of development. A phase contrast image of the colony at the final time point is provided (right) as a reference point of the measured confluency. Analysis of a second colony is provided in S6 Fig. Scale bar = 0.5 mm.

