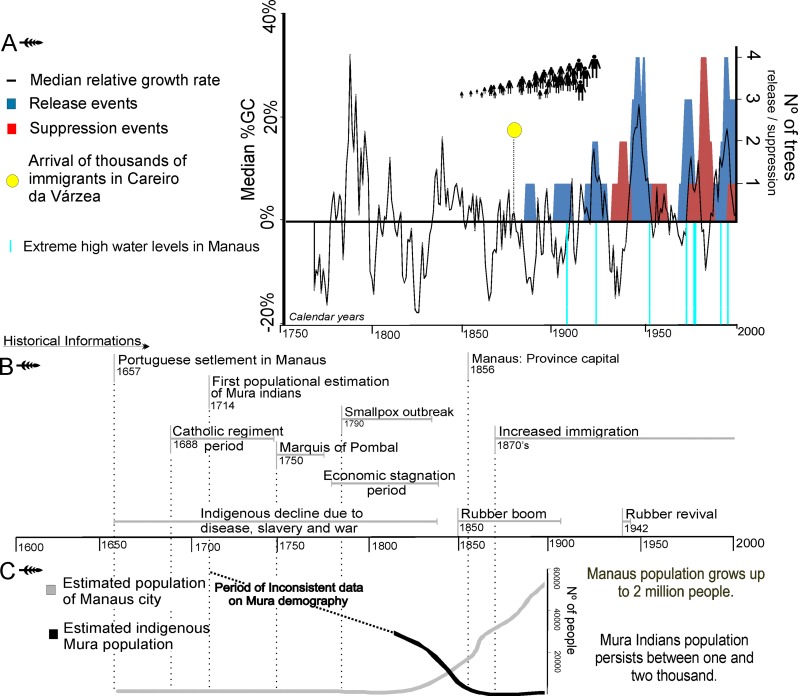
Fig 4. Integration of historical, climatic and forest dynamics information.
(A) Black line represents the median of percent growth change (%GC) among cored trees in the castanhal population. Red bars indicate the number of trees passing through suppression events and blue bars indicate the number of trees passing through release events. The human icons represent population growth in the study area stimulated by migration. The yellow dot indicates when hundreds of families were registered in the municipality to work in rubber extraction [55]. Extreme high water levels (1909, 1922, 1953, 1971, 1975, 1976, 1989, 1994, 1999) are based on records of water levels at Manaus since 1903 [64]. (B) Events of historical importance to understand the territorial dynamics of the study region in Central Amazonia. (C) Estimated population for indigenous Mura and colonizers (references are cited in the text).

