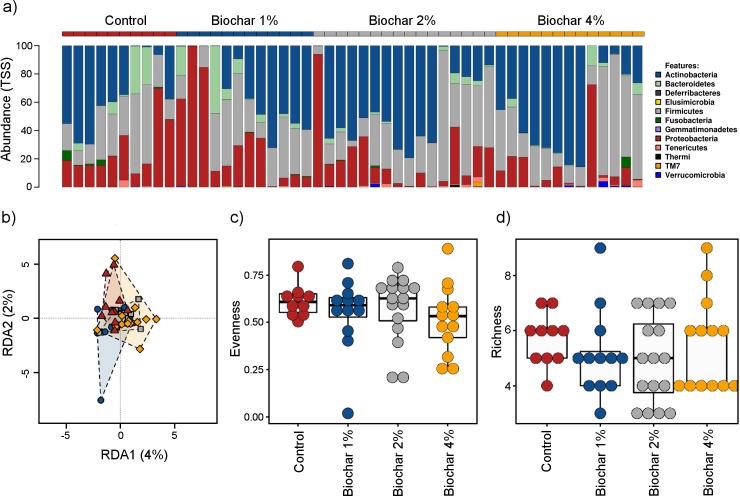
Fig 1. Microbial diversity in cloacal swabs of layer chickens fed for 23 weeks on control and 1%, 2% or 4% w/w biochar amended diets (Trial 1).
a) Relative phylum abundance; b) Phylum level redundancy analysis (RDA) plot shows no differentiation (P = 0.355) between dietary treatments; c) Evenness (phylum) and d) Richness (phylum) indices were not significantly different between any dietary treatment.

