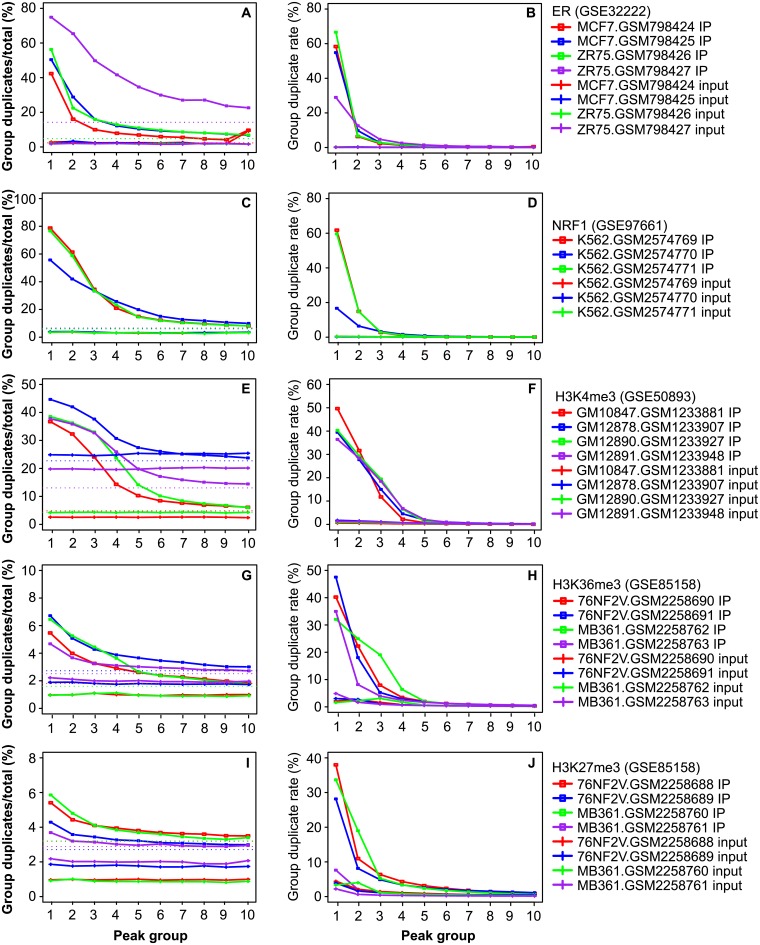
Fig 3. Plot of duplicate abundance versus peak confidence.
(A,C,E,G,I) Duplicate rate in 10 groups of peaks and in the corresponding regions in input. (B,D,F,H,J) Proportion of total library duplicates in each of the groups and in the corresponding regions in input. Peaks were sorted based on p value in ascending order and split into 10 equal-sized groups, with group 1 having the smallest p values. Y-axis in the left panels represents duplicate rate per group, i.e., the number of duplicates over the total uniquely mapped reads in a group, as defined in Fig 1 legend. Y-axis in the right panels represents the proportion of total duplicates from a library in each group and in the peak-corresponding regions in input. The dotted horizontal lines in the left panels denote duplicate rates in the non-peak regions in IP (> = 100 bp away from peaks). See S1 Table for sample information.

