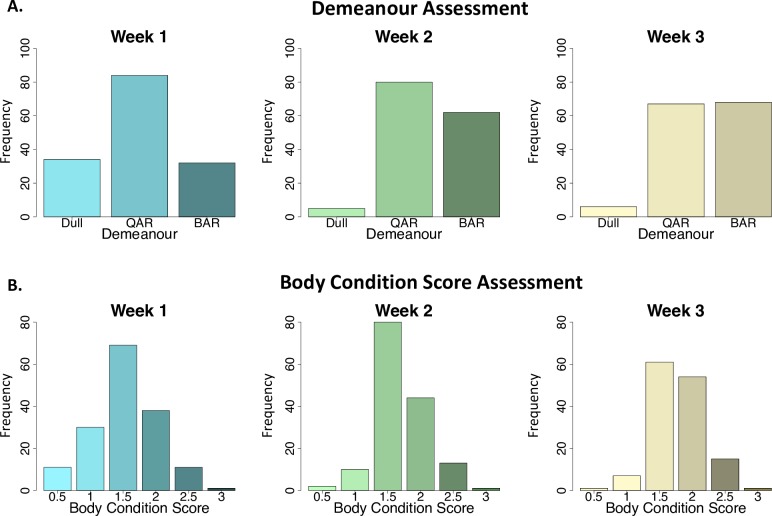
Fig 2. Bar plots illustrating categorisation of subjective parameters for the treatment trial population (n = 162).
Demeanour (A) and body condition score (B) were evaluated during the initial examination (week 1) and follow up post-treatment evaluations (weeks 2 and 3). Number of individuals (frequency) is plotted on the y-axis in each case. Bar plots represent the whole treatment trial population at each time point (week 1, week 2 and week 3). Demeanour (A) was assessed as BAR (bright, alert and responsive), QAR (quiet, alert and responsive) or dull. Assessed demeanour improved following treatment (week 1 to week 2) (p<0.001). Body condition (B) score (0-5/5) improved following trypanocidal treatment (p = 0.003).

