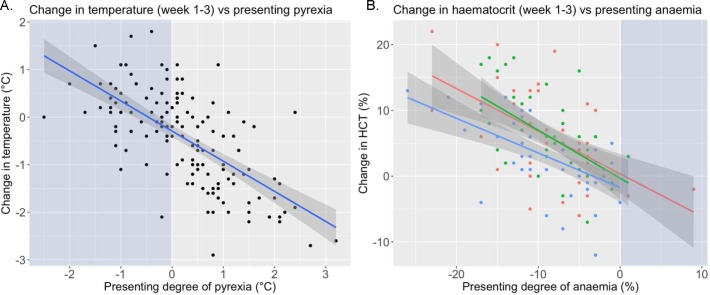
Fig 3. Scatterplots illustrating the change in clinical parameters from week 1 to 3.
A. Scatterplot showing individual changes in rectal temperature for whole treatment trial population (n = 162) following treatment. The regression line is marked in blue with 95% confidence intervals in dark grey. Light blue background shading illustrates animals presenting with parameters within reference range. B. Scatterplot showing individual changes in HCT, with colour coding to illustrate trypanocidal treatment group (melarsomine dihydrochloride = blue, diminazene = red and isometamidium = green) for whole treatment trial population (n = 162) following treatment. The regression line colour represents the trypanocide with 95% confidence intervals shown in dark grey. Presenting degree of anaemia (%) calculated by the difference between the animal’s HCT and the lower end of species appropriate reference values (donkey 27%; horse 31%).

