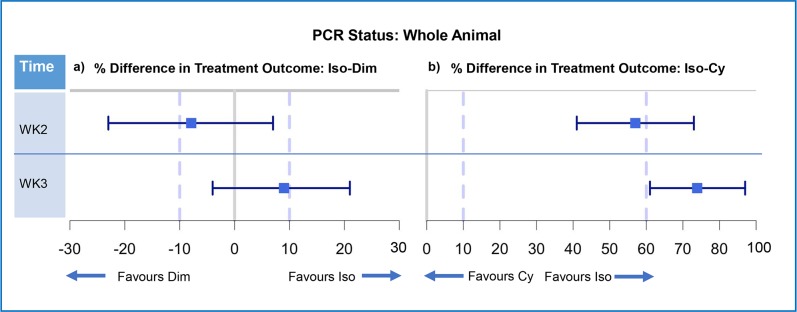
Fig 6. Forest plots illustrating non-inferiority analysis of the outcome of trypanocidal treatment by whole animal.
Forest plots illustrating non-inferiority analysis of control drug and test drug for whole animal (n = 162). a) Control (isometamidium) vs test (diminazene) b) Control (isometamidium) vs test (melarsomine dihydrochloride). Positive treatment outcome was defined as a negative PCR result for all Trypanosoma spp. The percentage difference in treatment outcome was presented as a point estimate (blue square) and two-sided 95% confidence intervals (blue bars). Results are presented as whole animal Trypanosoma spp. status by PCR and are divided by time point (week 2 and week 3). The 10% line represents M2, the accepted difference between drugs to demonstrate non-inferiority. The 60% line represents M1, the accepted difference between the drugs to demonstrate effect comparable to placebo.

