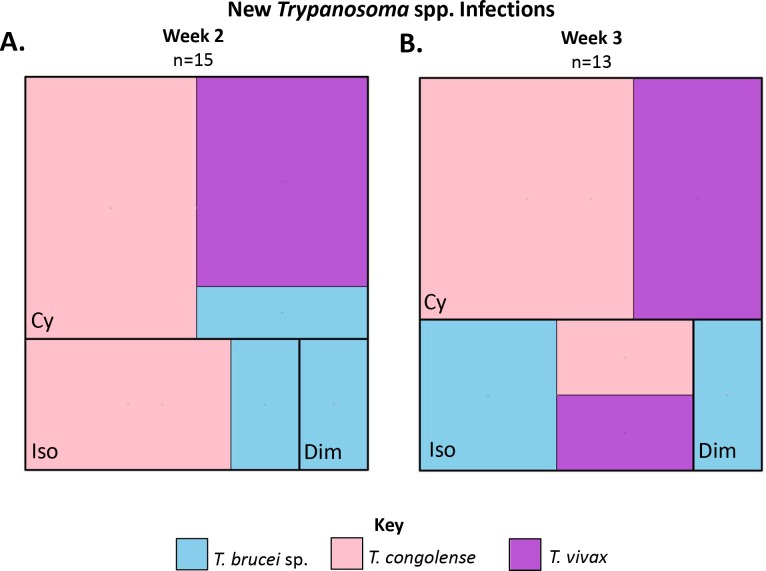
Fig 7. Tree maps illustrating the number of new PCR positive animals during the study period within the whole study population (n = 247).
The new positives are subdivided by trypanocidal treatment (Cy = melarsomine dihydrochloride, Dim = diminazene, Iso = isometamidium) and Trypanosoma sp (T. congolense = pink, T. brucei sp. = pale blue, T. vivax = purple). A. Tree map illustrating new PCR positives during week 2 (n = 15). B. Tree map illustrating new PCR positives during week 3 (n = 13).

