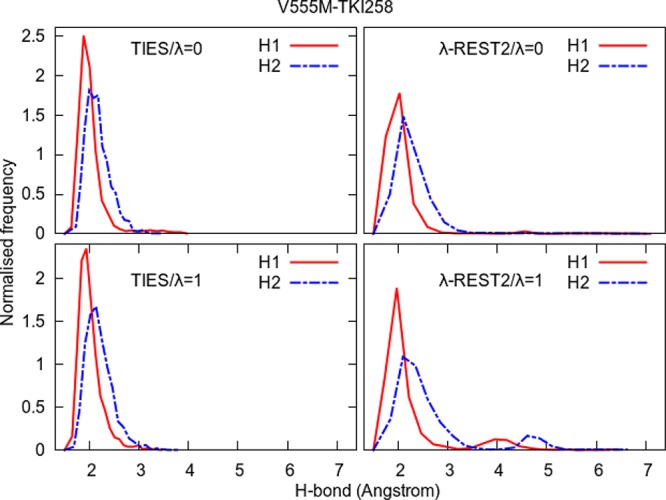
Figure 11.

Normalized frequency distributions of H1 and H2 from Figure 10 for the two end-points in the case of the standard TIES as well as λ-REST2 simulations of the V555M–TKI258 complex. λ-REST2 simulations sample a larger comformational space than TIES, as evidenced by the lower and wider distributions of the distances, and the second peaks in the λ = 1 end-point (V555M).
