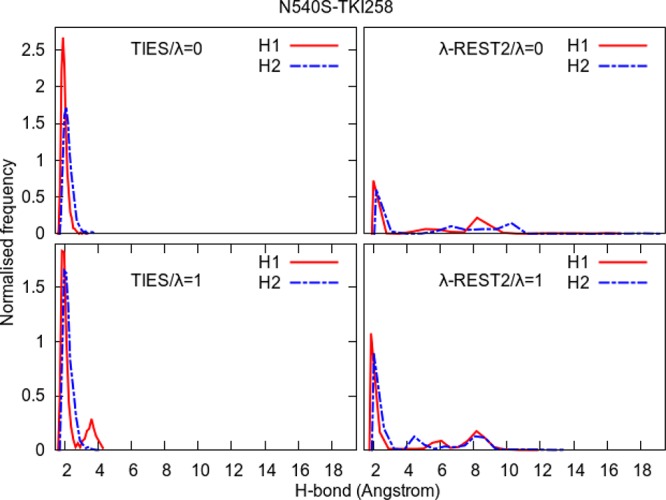
Figure 13.

Normalized frequency distributions of H1 and H2 from Figure 10 for the two end-points in the case of standard TIES as well as λ-REST2 simulations of the N540S–TKI258 complex. The long tails and additional peaks beyond 4 Å indicate that λ-REST2 simulations sample some conformations irrelevant to stable inhibitor binding.
