Figure 5.

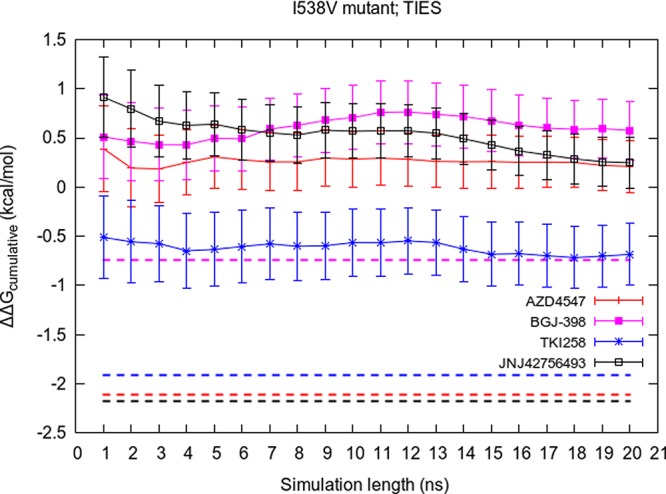
Variation of the cumulative average of ΔΔGcalcTIES with simulation length for all inhibitors bound to the FGFR3 I538V mutant. The corresponding experimental value for each inhibitor is shown by a dashed line of the same color.

Variation of the cumulative average of ΔΔGcalcTIES with simulation length for all inhibitors bound to the FGFR3 I538V mutant. The corresponding experimental value for each inhibitor is shown by a dashed line of the same color.