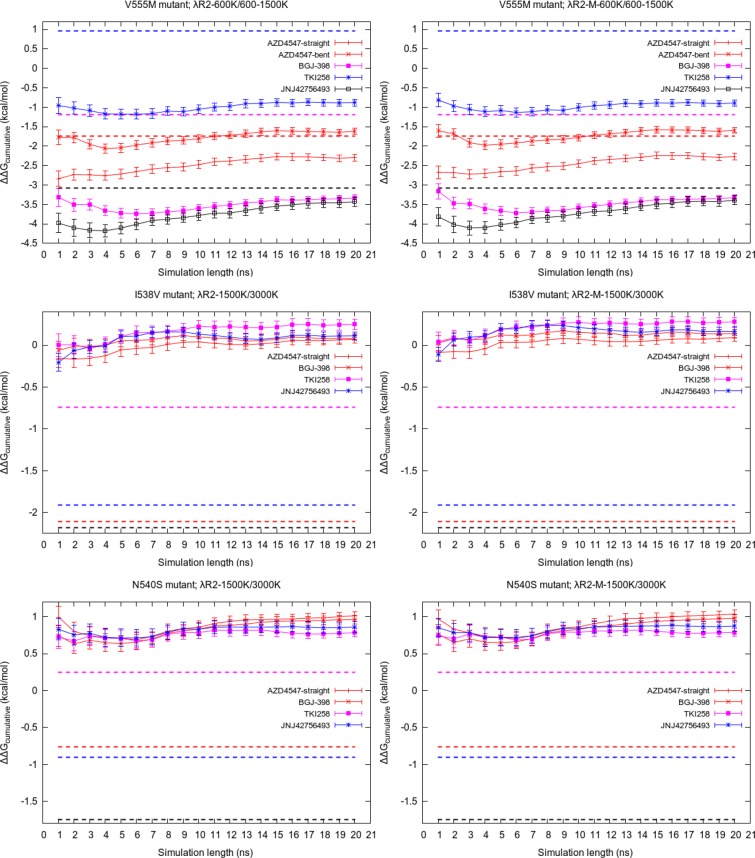
Figure 6.
Variation of the cumulative average of ΔΔG calculated using schemes λR2 and λR2-M with simulation length for all complexes. The highest Teff for receptor and complex are 1500 and 3000 K, respectively, in the case of I538V and N540S mutants, while the corresponding values in the case of V555M mutant are 600 and 600 K/1500 K. The corresponding experimental values for each inhibitor are shown by a dashed line of the same color.

