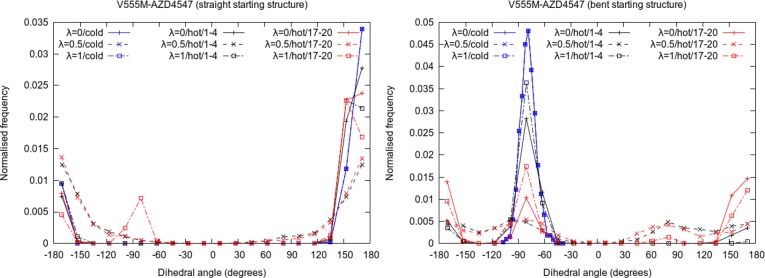
Figure 9.
Normalized frequency distributions of the dihedral angle between the four carbon atoms highlighted in orange in Figure 7 for different λ states of V555M–AZD4547 complexes in standard TIES (in blue) as well as λ-REST2 simulations showing the relative populations of the two conformations of AZD4547. In the case of λ-REST2 simulations, the distributions from the first (1–4 ns; in black) and the last 4 ns (17–20 ns; in red) are shown separately.

