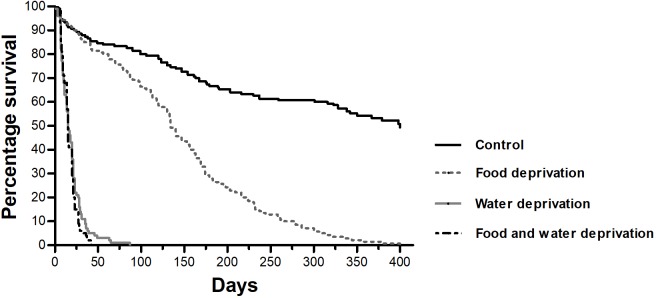
Fig 1. Kaplan-Meier survival analysis of Tityus serrulatus.
Percentage survival is shown for scorpions deprived of food (FD, dotted grey line, n = 140), water (WD, continuous grey line, n = 100), and both resources (FWD, dashed black line, n = 100). Control groups (continuous black line, n = 150) had unrestricted access to water and food. Data are representative of the three independent experiments.

