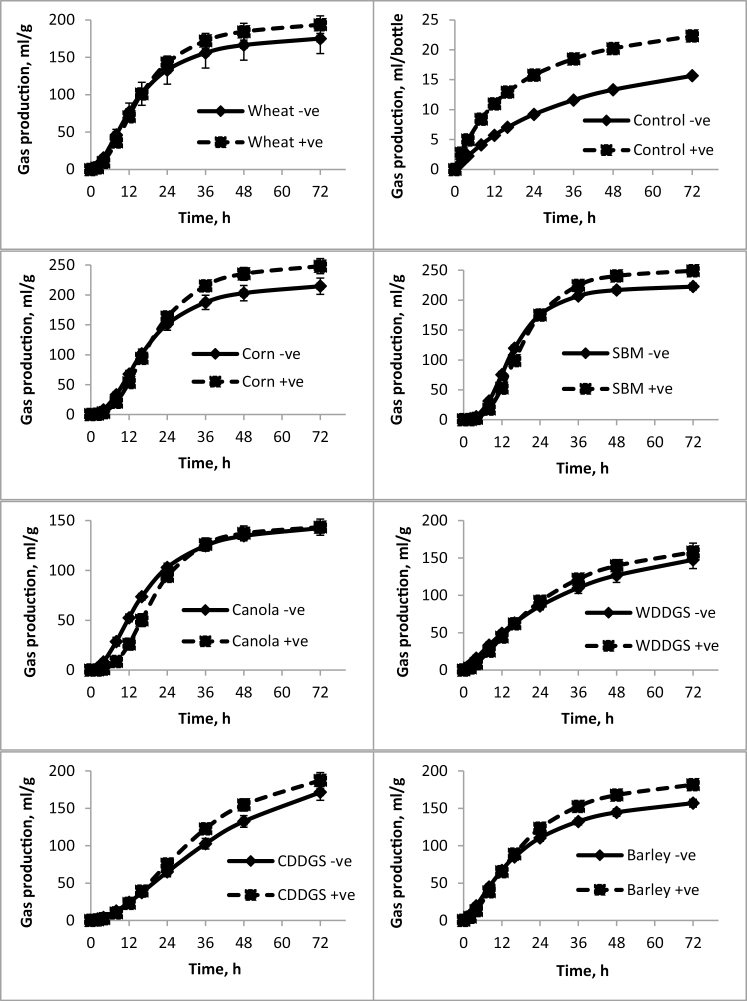
Figure 1.
Fitted gas accumulation curves modeled using a previously described mathematical formula (Groot et al., 1996) that show the amount of gas produced in milliliter per gram of DM and accumulated during the indicated time period in Study 1 when yeast was added in vitro. Values represent mean (n = 6) and SD of the mean. +ve means yeast was added and –ve means no yeast added.

