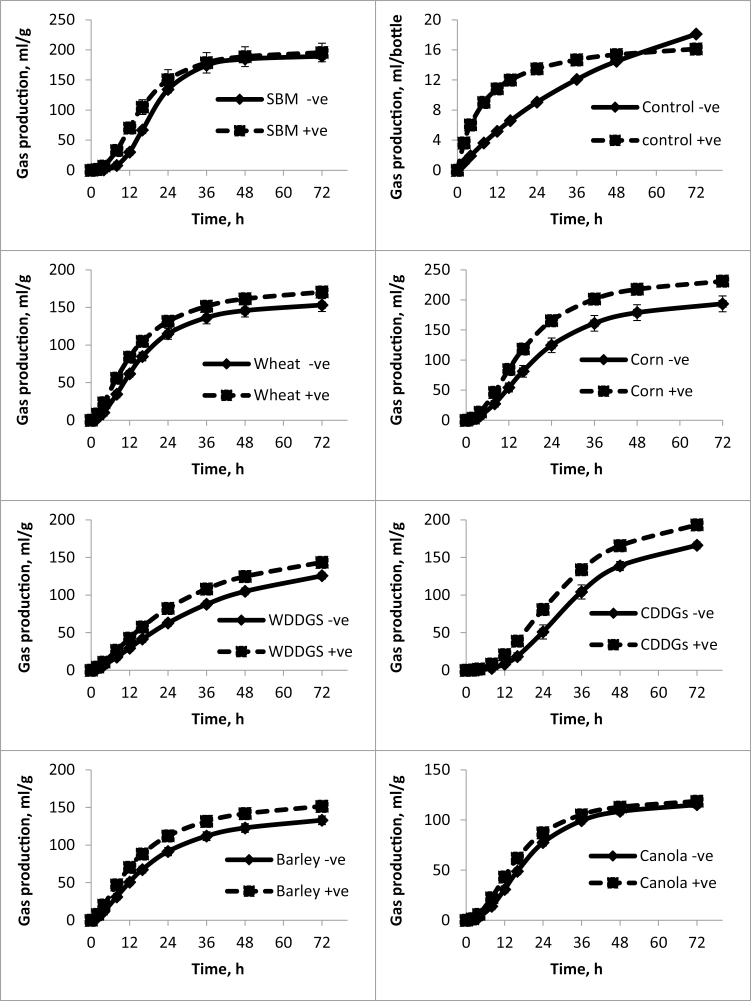
Figure 2.
Fitted gas accumulation curves modeled using a previously described mathematical formula (Groot et al., 1996) which show the amount of gas produced in milliliter per gram of DM and accumulated during the indicated time. Data for Study 2, Exp. 1 when yeast was fed to sows for 3 wk. Values represent mean (n = 3) and SD of the mean. +ve means yeast was added and –ve means no yeast added.

