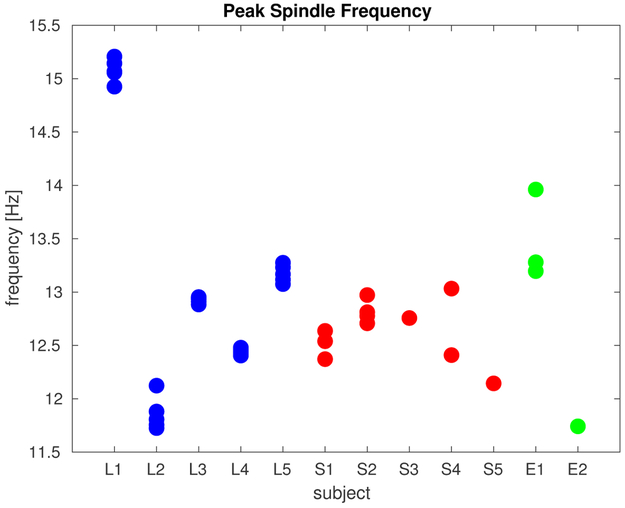
Figure 2:
Spindle frequencies. For each of the five laminar, five sEEG, and two ECoG subjects, the peak frequency (between 11 and 17 Hz) was computed for all human-marked spindles and the mean peak frequency across all spindles is plotted as one point for each channel. For laminar subjects, five of the channels are plotted–spindles were marked based on evaluation of all channels. For the sEEG and ECoG subjects, spindles were marked on an individual-channel basis, and all scored channels are plotted. Color indicates the type of recording. Note that laminar recordings were collected from cortex identified as probably epileptogenic.

