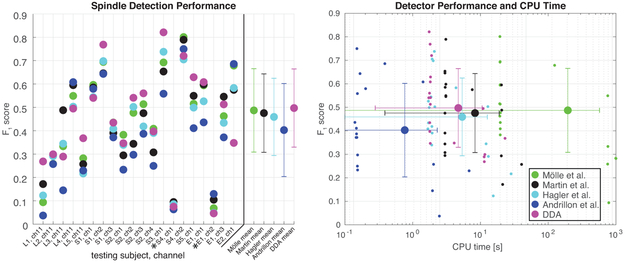
Figure 4:
Detection methods comparison. In the left panel, F1 score is plotted for a set of automated spindle detection methods and DDA for the various Laminar, sEEG, and ECoG recordings. The means (points) and standard deviations (bars) across all recordings for each detector are plotted at the far right-these exclude two recordings (denoted by *) of poor quality for which all methods yield low performance. These recordings are also omitted from the right panel. At right, the F1 score for all recordings is plotted against CPU time for each detection method. Each detector was run on twenty intracranial recordings, the mean across all recordings (except the two noted exclusions) is plotted with a larger marker, standard deviations across all recordings are plotted as bars in both CPU time and F1 score. Note that not all recordings are of equal length, so some variation in the CPU time is to be expected.

