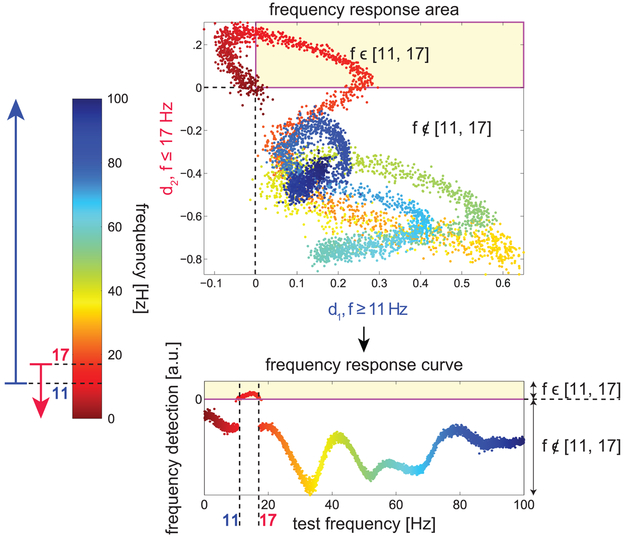
Figure 7:
Frequency band detection. Applying the DDE model with two different delay pairs, one sensitive to frequencies above 11 Hz and one sensitive to frequencies below 17 Hz, we can obtain an output which is positive only in the desired band. In the top panel, the distance from the hyperplane values computed from both DDEs (d1 and d2) are plotted for test frequencies ranging from 0.1 to 100 Hz. The frequency of the test data is color-coded according to the color bar at left, from 0.1 (red) to 100 Hz (blue). Points falling into the upper right quadrant (shaded yellow) have positive values for both d1 and d2, and we select delays such that only frequencies in the desired range (11-17 Hz) fall into this area. In the lower plot, d1 and d2 are combined according to Eq. (9) to obtain a one-dimensional index that is positive only for frequencies in the desired range. This procedure was also used to obtain delays and corresponding weights for frequency ranges 11-14 Hz and 12-15 Hz.

