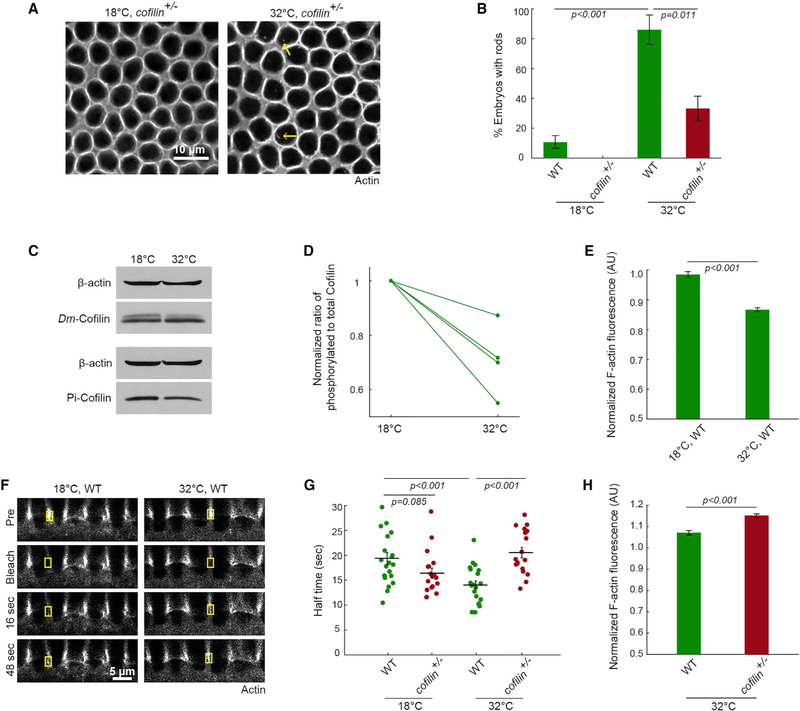
Figure 3. Cofilin Mediates an ASR that Changes Actin Organization in Nuclei and Cytoplasm.
(A) Surface views show G-actinRed in furrow tips in cofilin+/− embryos at the indicated temperatures. Intra-nuclear rods (yellow arrows) are reduced in cofilin+/− embryos at 32°C.
(B) Percentage of embryos with rods in wild-type (WT) and cofilin+/− embryos at the indicated temperatures (n ≥ 14 embryos per condition, with ~500 nuclei analyzed per embryo; mean ± SE).
(C) Representative western blots for Dm-Cofilin, Pi-cofilin from WT embryos at the indicated temperatures. β-actin is used as a loading control. Antibody validation in Figure S2.
(D) Ratio phosphorylated to total Cofilin in WT embryos at the indicated temperatures (n = 4 independent experiments; mean ± SE).
(E) F-actin levels in furrow tips in WT embryos at the indicated temperatures (n ≥ 29 embryos per temperature, with 15 furrows analyzed per embryo; mean ± SE). Normalization to Histone-GFP embryos at 25°C, according to Figure S3.
(F) Cross sections show FRAP of furrow tip F-actin (G-actinRed) in WT embryos at the indicated temperatures. Yellow boxes show bleached furrow tips. Pre, immediate pre-bleach time point; bleach, immediate post-bleach time point; sec, seconds after bleach.
(G) FRAP kinetics for furrow tip F-actin in WT and cofilin+/− embryos at indicated temperatures. Each point represents one embryo (n ≥ 14 embryos per temperature, with 1–3 furrows analyzed per embryo; horizontal lines represent means ± SE).
(H) F-actin levels in furrow tips in WT and cofilin+/− embryos at 32°C (n R 48 embryos per condition, with 15 furrows analyzed per embryo; mean ± SE). Normalization to Histone-GFP embryos at 32°C.
(E) and (H) correspond to scatterplots in Figures S4C and S4D.
Student’s t test used to calculate p values in (B), (E), (G), and (H).

