
Figure 3.
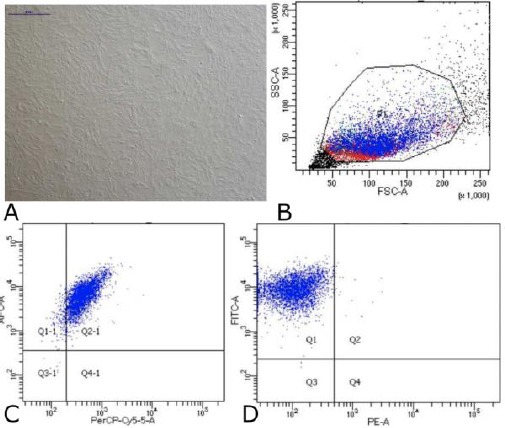
Data on Characteristics of Mesenchymal Stem Cells Wharton Jelly. (A) Cells MSC-WJ reach confluence. Scale bar: 500 µM. Photographs of cells taken using a Nikon Ti-S microscope. (B) Data flow cytometry. Forward scatter (FCS) plot & side scatter (SSC) plot. Population gated events (P1): 20,000. (C) Cell surface markers expression: CD73-APC 99.8% and CD105- PerCP-Cy5.5 95%. (D) Cell surface markers expression: CD90-FITC 99.9% and Lin (-) - PE 0.4%