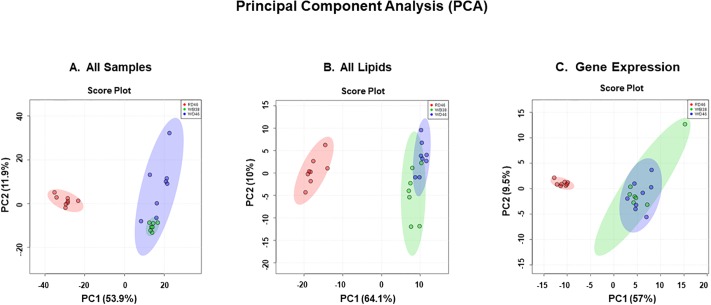
Fig 2. Overall statistical analysis of anthropometric, transcriptomic and lipidomic data.
Panel A: Principal component analysis (PCA) of all anthropometric, transcriptomic and lipidomic data. All anthropometric, plasma, transcriptomic and lipidomic data was assembled into an Excel spreadsheet for mice in the 3 groups (RD46, WD38 and WD46). The data was analyzed using the statistical package in http://www.metaboanalyst.ca/MetaboAnalyst/ [53]. Panels B: PCA analysis of all lipid data including both GC and LC/MS data. Panel C: PCA analysis of all transcriptomic data.

