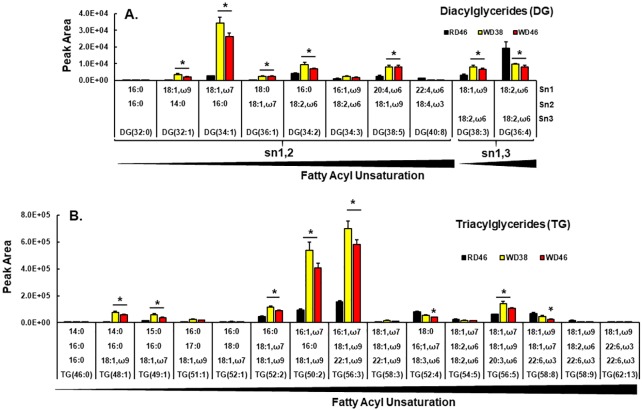
Fig 8.
Western diet effects on hepatic diacylglycerols (DG) [A] and triacylglycerols (TG) [B]. DG and TG were quantified using an un-targeted LC/MS approach (Materials and methods). Results in Panel A and B represents the peak area of specific DG and TG. Results are presented as mean ± SEM, N = 7–8 samples), *, FDR ≤ 0.05 versus the RD46 group. The lipids are arranged by increasing fatty acyl chain unsaturation within specific DG or TG.

