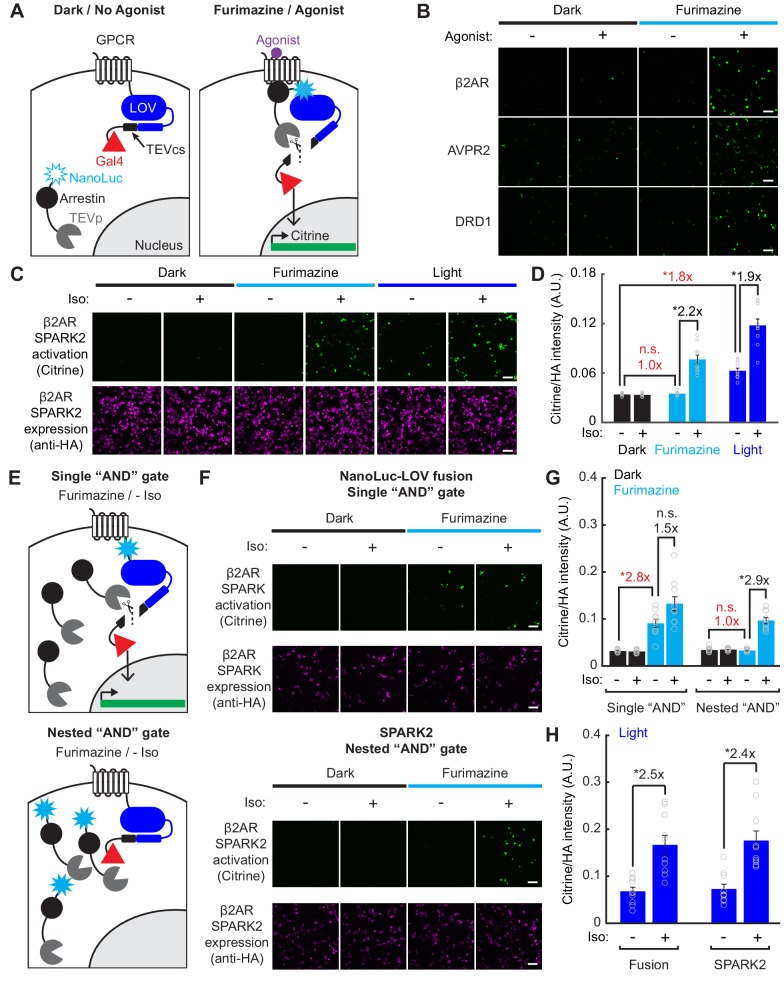
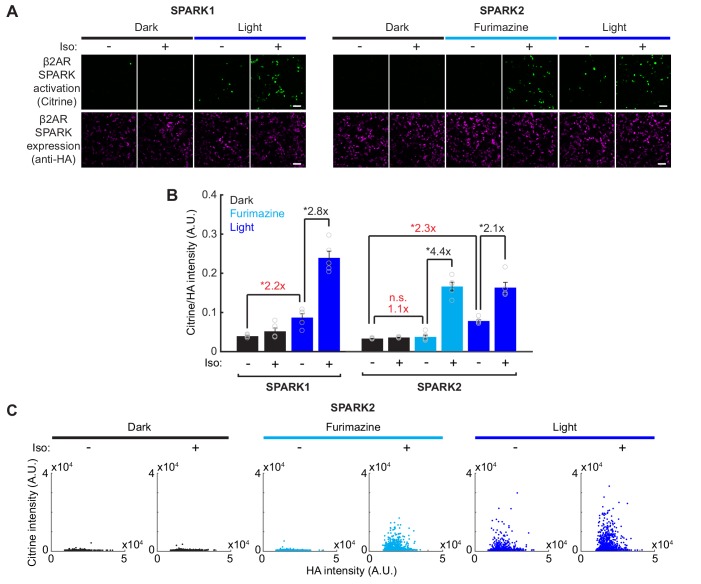
Figure 3. Reduced background during transcriptional read-out of PPIs with a nested ‘AND’ gate in SPARK2.
(A) Schematic of NanoLuc fused to arrestin-TEVp, co-expressed with GPCR-LOV-TEVcs-Gal4 and UAS-Citrine. In the dark and in the absence of the GPCR’s agonist, the TEVcs is caged by the LOV domain and the NanoLuc-arrestin-TEVp is not in proximity to the TEVcs. In the presence of both furimazine and agonist, NanoLuc-arrestin-TEVp is recruited to the GPCR, allowing NanoLuc to uncage eLOV and the TEVp to cleave the TEVcs. The released Gal4 then drives transcription of a UAS reporter gene. (B) Example immunofluorescence images of UAS-Citrine expression in HEK293T cells ~ 8 hr following 10 µM furimazine and agonist (20 min 100 µM isoetharine for β2AR, 15 min 10 µM vasopressin for AVPR2, 2 hr 10 µM dopamine for DRD1). Control conditions without agonist and/or without furimazine had low Citrine expression. Scale bars, 100 µm. (C) HEK293T cells were transfected with β2AR SPARK2 components as in panel A). SPARK2 activation (Citrine reporter) and SPARK2 expression (HA tag on NanoLuc-arrestin-TEVp) were imaged ~8 hr after 15 min of exposure to 10 µM furimazine or light and 10 µM isoetharine. (D) All HA-positive cells were quantified by their Citrine to HA fluorescence intensity ratio. Background fold changes in Furimazine/-Iso and Light/-Iso signal are displayed in red, while ±Ligand signal ratios are displayed in black. There was no additional background signal in the Furimazine/-Iso condition compared to the Dark/-Iso condition (1.0-fold), whereas the Light/-Iso condition had a significant 1.8-fold increase in background compared to the Dark/-Iso condition. There was a 2.2-fold ± Iso signal ratio with furimazine, and a 1.9-fold ± Iso signal ratio with light (n = 10 FOVs each group, two-way ANOVA, interaction F(2,54)=25.49, p = 1.61e-8; Tukey’s multiple comparison’s test, *p < 0.001). Data plotted as mean ± s.e.m. (E) Top: Schematic illustrating potential for background TEVcs cleavage in the absence of a PPI using a luciferase-mediated single ‘AND’ gate (NanoLuc directly fused to N-terminus of LOV domain). Bottom: Schematic illustrating negligible background TEVcs cleavage in the absence of a PPI using the luciferase-mediated nested ‘AND’ gate in SPARK2 (NanoLuc fused to arrestin-TEVp). (F) HEK293T cells were transfected either with a modified β2AR-NanoLuc-LOV direct fusion SPARK construct and Arrestin-TEVp (top) or β2AR SPARK2 components (bottom). SPARK activation (Citrine reporter) and SPARK expression (HA tag on Arrestin-TEVp or NanoLuc-arrestin-TEVp) were imaged ~8 hr after continuous exposure to 10 µM furimazine and 10 µM isoetharine. Scale bars, 100 µm. (G) Data were quantified as in panel D). In the modified fusion SPARK (single ‘AND’ gate), there was not a robust ±Iso signal ratio with furimazine (1.5-fold, not significant, n.s.), and a 2.8-fold background increase due to furimazine alone (n = 10 FOVs each group, two-way ANOVA, interaction F(2,54)=14.11, p = 1.18e-5; Tukey’s multiple comparison’s test, *p < 0.001). In SPARK2 (nested ‘AND’ gate), there was a 2.9-fold ± Iso signal ratio with furimazine, and no significant background due to furimazine alone (1.0-fold, n.s.; n = 10 FOVs each group, two-way ANOVA, interaction F(2,54)=9.82, p = 2.0e-4; Tukey’s multiple comparison’s test, *p < 0.001). Data plotted as mean ± s.e.m. (H) HEK293T cells transfected as in panel F) were exposed to blue light for 5 min, with or without 10 µM isoetharine. The fusion and SPARK2 conditions resulted in similar ±Iso signal ratios with light, 2.5- and 2.4-fold, respectively (Data analyzed in two-way ANOVA with data from panel (G). Fusion: n = 10 FOVs each group, two-way ANOVA, interaction F(2,54)=14.11, p = 1.18e-5; SPARK2: n=10 FOVs each group, two-way ANOVA, interaction F(2,54) = 9.82, p = 2.0e-4; Tukey’s multiple comparison’s test, *p < 0.01). Data plotted as mean ± s.e.m. See also Figure 3—figure supplement 1.


