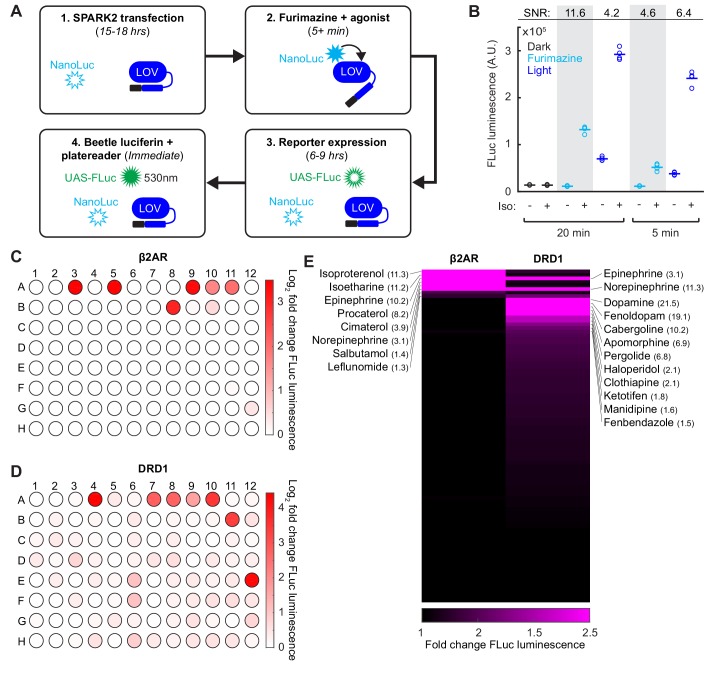
Figure 4. SPARK2 is compatible with an orthogonal luciferase reporter to enable high-throughput drug-screens for GPCR activation.
(A) Schematic of the general timeline for SPARK2 assays using an orthogonal luciferase reporter such as FLuc. For simplicity, only the luciferases and LOV domain are illustrated (unfilled luciferases indicate no luminescence; filled luciferases indicate luciferin substrate-mediated luminescence). (B) HEK293T were transfected with β2AR SPARK2 components and UAS-FLuc.~8 hr after SPARK2 labeling with 10 µM furimazine/blue light and 10 µM isoetharine, the UAS-FLuc luminescence recorded using a platereader (n = 4 replicates each condition). The highest ±Iso signal ratio was achieved using 20 min exposure to furimazine (11.6-fold). 5 min of blue light resulted in a ± Iso signal ratio of 6.4-fold, whereas 20 min of blue light or 5 min of furamizine resulted in similar ±Iso signal ratios of 4.2- and 4.6-fold, respectively. (C–D) HEK293T cells were transfected with either β2AR or DRD1 SPARK2 components and UAS-FLuc. Cells were exposed to 10 µM furimazine and 5 µM each of 92 different drugs for 1 hr (BioMol FDA-approved compound library). In addition, we performed two DMSO vehicle measurements (A1–A2), and two positive control spike-ins (isoetharine in A3 and dopamine in A4). ~8 hr later, FLuc luminescence was measured on a platereader. The Log2 fold change in FLuc luminescence is plotted corresponding to each compound’s position in the 96-well plate. Data plotted as the average of two biological replicates. Compound list and positions in Figure 4—source data 2. (E) Sorted heatmap of fold changes in FLuc luminescence for β2AR and DRD1 SPARK2 for all 94 compounds (excluding DMSO replicates). Example compound hits for each receptor are labeled. Heatmap thresholded from 1 to 2.5 for visualization, mean fold-changes for selected hits listed in parentheses. Fold-changes for all compounds listed in Figure 4—source data 2.


