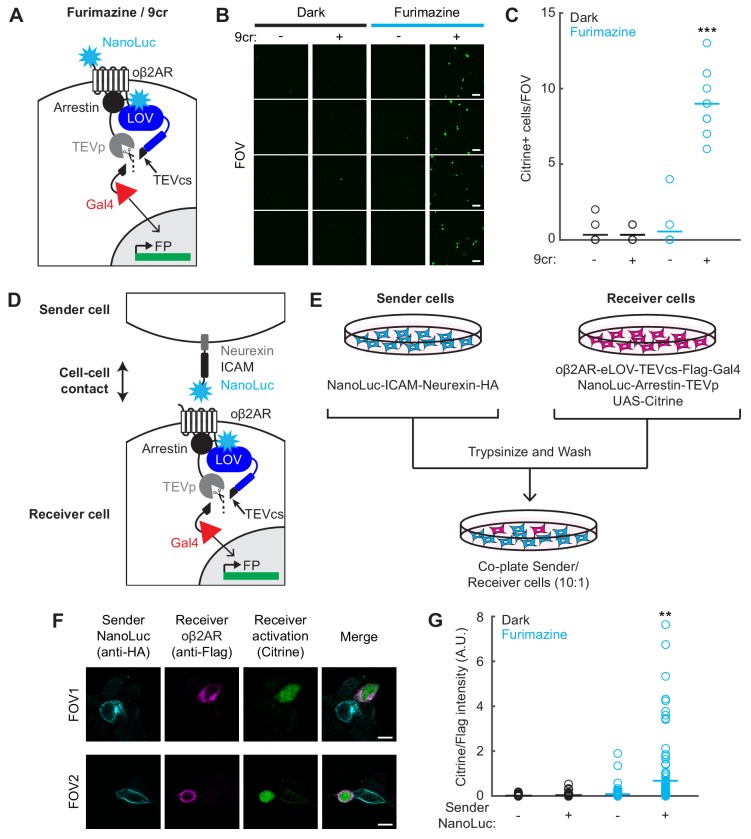
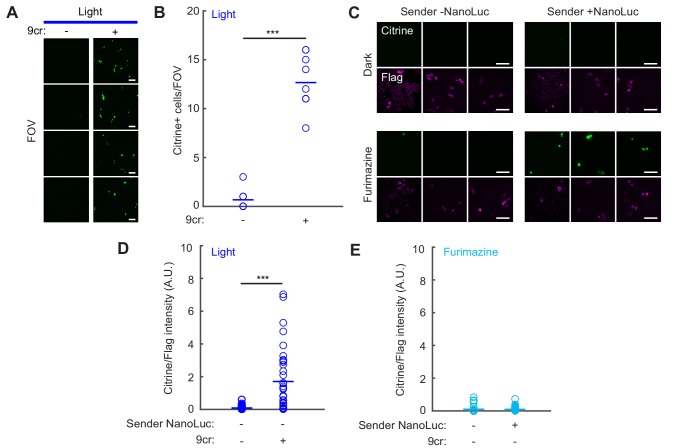
Figure 5. Detection of cell-cell contacts using NanoLuc-oβ2AR activation with SPARK2.
(A) Schematic of an extracellular NanoLuc fused to oβ2AR-eLOV-TEVcs-Gal4, co-expressed with NanoLuc-arrestin-TEVp and UAS-Citrine. (B) Citrine expression in HEK293T cells infected with lentiviruses expressing components in A) and exposed to 10 µM furimazine and 50 µM 9-cis-retinal (9cr) for 30 min. In control conditions, 9cr was omitted and/or furimazine was omitted. Scale bar, 100 µm. (C) There were significantly more Citrine-positive cells per field of view ~24 hr following furimazine and 9cr exposure compared to in control conditions (Dark/−9cr: 0.33 ± 0.24; Dark/+9cr: 0.33 ± 0.17; Fur/−9cr: 0.56 ± 0.44; Fur/+9cr: 9.0 ± 0.71; n = 9 fields of view each condition; two-way ANOVA, interaction F(1,32)=91.32, p = 6.80e-11; Tukey’s multiple comparison’s test ***p < 0.001 compared to all other conditions). (D) Schematic for detecting cell-cell contacts in which a Sender cell expresses NanoLuc-ICAM-Neurexin, and a Receiver cell expresses oβ2AR-eLOV-TEVcs-Gal4, NanoLuc-Arrestin-TEVp, and UAS-Citrine. (E) Experimental paradigm for co-plating Sender and Receiver cells in a 10:1 ratio. (F) Example immunofluorescence images of Citrine-positive Receiver cells that are adjacent to HA-positive Sender cells expressing NanoLuc. The Flag stains against Receiver cells expressing the oβ2AR SPARK2 components. 87% of all detected Citrine-positive Receiver cells were adjacent to an HA-positive Sender cell. Scale bars, 10 µm. (G) Quantification of Citrine/Flag fluorescence intensity ratios for all Flag-positive cells. The Citrine/Flag intensity ratio was significantly higher following furimazine exposure when Sender NanoLuc was expressed compared to in control conditions where NanoLuc was not expressed in the Sender cells (Dark/Sender -NanoLuc: 0.016 ± 0.0037, n = 92 cells; Dark/Sender +NanoLuc: 0.039 ± 0.0074, n = 109 cells; Fur/Sender -NanoLuc: 0.082 ± 0.025, n = 95 cells; Fur/Sender +NanoLuc: 0.68 ± 0.14, n = 104 cells; two-way ANOVA, interaction F(1,396)=15.6, p = 9.28e-5; Tukey’s multiple comparison’s test, **p < 0.001 compared to all other conditions). See also Figure 5—figure supplement 1.


