
Figure 2. Significant SE/CTL ratios in SPN and ST in LFQ data.
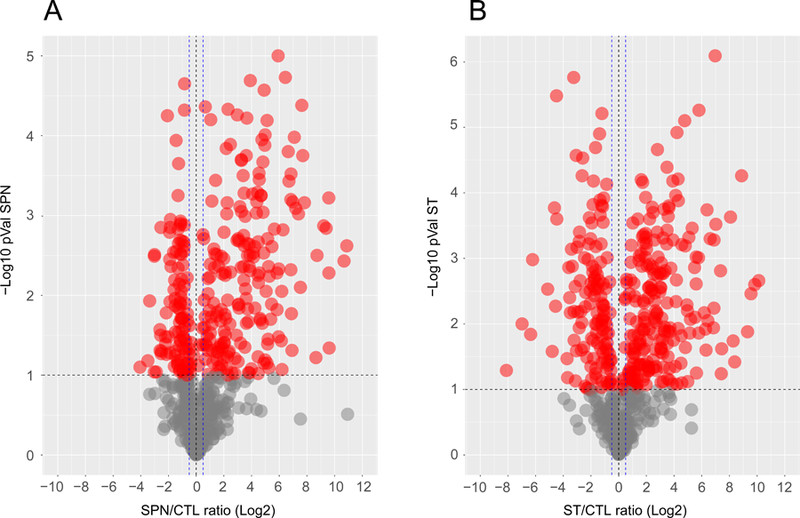
Volcano plots from (A) SPN and (B) ST data. Each dot represents a protein as the cross-correlation between the p-Value (-Log10) and the corresponding SE/CTL ratio Log2. Proteins with a p-Value ≥ 1.0 -Log10 are colored red. The black horizontal line indicates a cut-off of 1.0 for the p-Value. Statistically significant SE/CTL ratios are indicated by blue vertical dashed lines (+/− 0.5 SE/CTL (Log2) ratio).