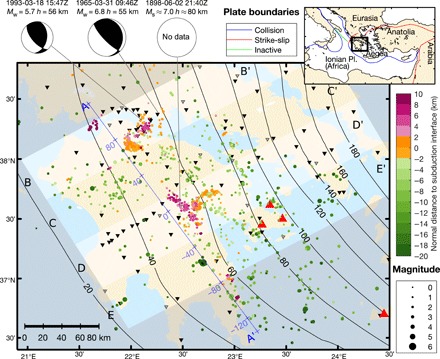
Fig. 1. Map of the Peloponnese region of the Hellenic subduction zone.

The displayed area is indicated in the plate boundary map in the inset. The map shows the seismicity from 2006 to 2017 investigated in this study (colored circles), arc volcanoes (red triangles), and the depth contours of the top of the Ionian slab [black lines: inferred interface from (16) with small adjustments described in the Supplementary Materials], which subducts beneath the region from southwest to northeast. Seismograph stations (inverted triangles) with more than 100 observations are displayed (filled black: waveforms used in analysis; gray outline: only picks used). Beach balls depict the focal mechanisms of three major historic earthquakes that are believed to have occurred on the plate interface at depths that are unusually large for interplate earthquakes. Vertical profiles of seismicity across sections A-A′ to E-E′ are shown in Fig. 2.
