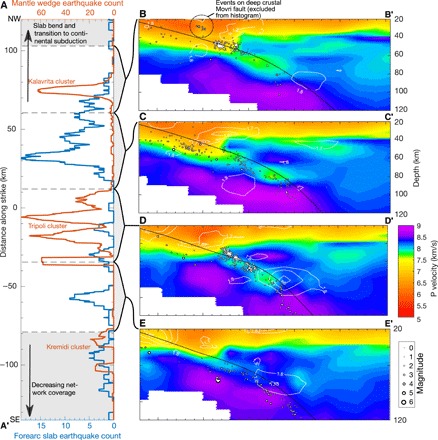
Fig. 2. Distribution of slab earthquakes and seismic velocity structure beneath western Greece.

(A) Number of mantle wedge earthquakes (located above the plate interface) and forearc slab earthquakes (located updip of line A-A′ in Fig. 1) along the subduction strike, calculated with a 5-km-wide moving window. The curves are anticorrelated, indicating that clusters of mantle wedge seismicity are associated with updip segments of reduced intraslab seismicity. (B to E) Body wave tomographic images from (16) along four cross sections (see Fig. 1 for locations) showing the low-velocity subducting crust and relocated seismicity with absolute or relative location errors of <5 km. Contour lines indicate areas with Vp/Vs ratio of >1.8 and <1.7 (see fig. S2 for full Vp/Vs ratio structure). High values indicate the presence of free fluid or melt, particularly in the subarc mantle, while low values point to quartz enrichment in the lower overriding crust (18).
