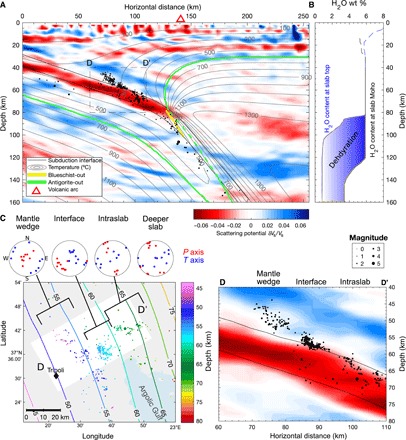
Fig. 3. Seismic and thermal attributes of the Tripoli cluster of mantle wedge earthquakes.

(A) Cross section (same location as Fig. 2D) of all earthquakes with location errors of <2.5 km superimposed on a teleseismic scattered wave image (13, 16), with temperature contours from the geodynamic model and main dehydration reactions outlined in color (see legend). The background color scale represents scattering potential in terms of relative S-wave speed (Vs) perturbations. The image resolves two main features: the hydrated subducting oceanic crust denoted by a low-velocity (red) dipping layer and the Moho of the overriding plate denoted by a downward slow-to-fast velocity (red-to-blue) contrast at a depth of ~25 km. (B) Water content at the top and bottom of a fully hydrated subducted crust calculated from thermal-petrologic models. No major dehydration reaction occurs before the crust reaches depths of >80 km. (C) Map view of the Tripoli cluster grouped by earthquake category and associated focal mechanisms (see fig. S3 for individual mechanisms). (D) Magnified cross section centered on the Tripoli cluster [see areas indicated D-D′ in (A) and (C)] showing earthquakes with relative location errors of <0.25 km.
