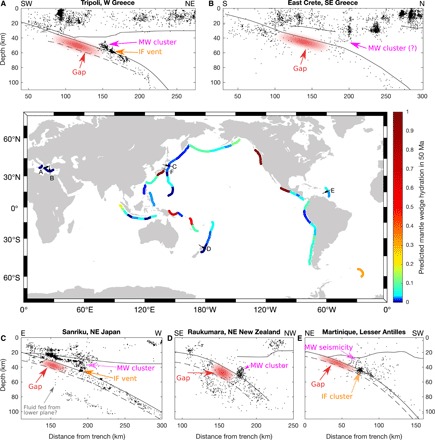
Fig. 4. Clusters of mantle wedge seismicity.

The map indicates the worldwide distribution of subduction zones and their calculated hydration state after 50 Ma of slab dehydration [data from (1) and (2)]. Observations of mantle wedge seismicity are shown in cross sections A to F. (A) Seismicity for the Tripoli cluster studied in this paper. (B) Seismicity for east Crete. (C) Seismicity for offshore Sanriku. (D) Seismicity for Raukumara. (E) Seismicity for Martinique in the Lesser Antilles. The exact location of cross sections and the data sources are listed in table S3 (description in Supplementary Text). A similar observation not shown here has been made onshore Chiba [east Japan, indicated as F on the map (10)]. The updip gap in seismicity is shaded in red. Where distinguishable, the vent marked by a cluster of seismicity on the interface (IF) is indicated, along with the cluster of mantle wedge (MW) seismicity.
