
Fig. 1. MMP-10 is increased in gastric mucosa of H. pylori–infected patients and mice.
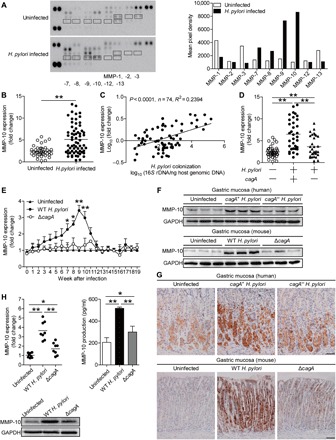
(A) Representative MMP array results for human primary gastric mucosa of H. pylori–infected patients and paired uninfected donors using Ab microarrays. Profiles of mean spot pixel density were created using a transmission-mode scanner and image analysis software (ImageJ, National Institutes of Health). (B) MMP-10 mRNA expression in gastric mucosa of H. pylori–infected (n = 65) and uninfected donors (n = 40) was compared. (C) The correlation between MMP-10 expression and H. pylori colonization in gastric mucosa of H. pylori–infected patients was analyzed. (D) MMP-10 mRNA expression in gastric mucosa of cagA+ H. pylori–infected (n = 34), cagA− H. pylori–infected (n = 31),and uninfected donors (n = 40) was compared. (E) Dynamic changes of MMP-10 mRNA expression in gastric mucosa of WT H. pylori–infected, ΔcagA-infected, and uninfected mice. n = 5 per group per time point in (E). (F and G) MMP-10 protein in gastric mucosa of cagA+ H. pylori–infected, cagA− H. pylori–infected, and uninfected donors or in gastric mucosa of WT H. pylori–infected, ΔcagA-infected, and uninfected mice at 9 weeks p.i. was analyzed by Western blot (F) and immunohistochemical staining (G). Scale bars, 100 μm. (H) MMP-10 mRNA expression and MMP-10 protein in/from human primary gastric mucosa from uninfected donors infected with WT H. pylori or ΔcagA ex vivo analyzed by real-time polymerase chain reaction (PCR), Western blot, or enzyme-linked immunosorbent assay (ELISA) (n = 8). The horizontal bars in (B), (D), and (H) represent mean values. Each ring or dot in (B) to (D) and (H) represents one patient or donor. *P < 0.05, **P < 0.01 for groups connected by horizontal lines or compared with uninfected mice. GAPDH, glyceraldehyde phosphate dehydrogenase.