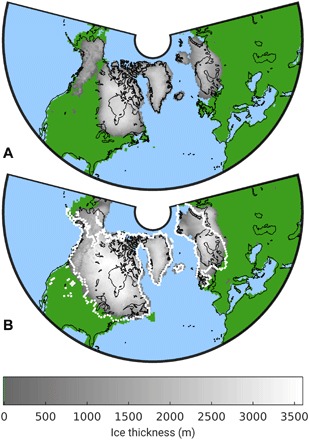
Fig. 5. Pre- and post-MPT ice sheets.

Modeled maximum ice thickness in each grid cell (A) before and (B) after the MPT. The dotted lines in (B) indicate the reconstructed ice extent at the last glacial maximum.

Modeled maximum ice thickness in each grid cell (A) before and (B) after the MPT. The dotted lines in (B) indicate the reconstructed ice extent at the last glacial maximum.