
Fig. 5. Pre- and post-MPT ice sheets.
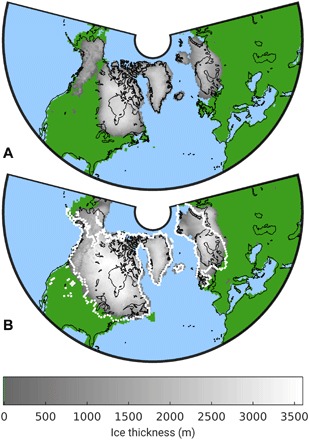
Modeled maximum ice thickness in each grid cell (A) before and (B) after the MPT. The dotted lines in (B) indicate the reconstructed ice extent at the last glacial maximum.
Official websites use .gov
A
.gov website belongs to an official
government organization in the United States.
Secure .gov websites use HTTPS
A lock (
) or https:// means you've safely
connected to the .gov website. Share sensitive
information only on official, secure websites.
Modeled maximum ice thickness in each grid cell (A) before and (B) after the MPT. The dotted lines in (B) indicate the reconstructed ice extent at the last glacial maximum.