
Fig. 1. Distribution and attribution of summer daytime surface UHIs across North America.
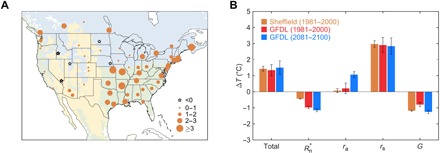
(A) Distribution of simulated surface UHIs across 60 cities using the Sheffield forcing in 1981–2000: continental region (16 cities; blue), arid region (10 cities; yellow), and temperate region (34 cities; green). (B) Attribution of surface UHIs in current and future climates to different biophysical factors using the TRM method. , ra, rs, and G represent contributions from net radiation, aerodynamic resistance, surface resistance, and heat storage, respectively. “Total” represents the sum of four contributions.