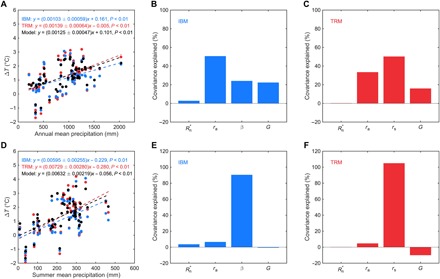
Fig. 2. Relationship between precipitation and modeled daytime ΔT among cities.

The top panels show annual mean results. The bottom panels show summer mean results. (A and D) The correlation between daytime ΔT and precipitation in 1981–2000. Dash lines are linear regression fits to ΔT from the climate model (black), ΔT from the IBM method (blue), and ΔT from the TRM method (red). Parameter bounds for the regression slope are the 95% confidence interval. (B, C, E, and F) ΔT-precipitation covariance explained by contributions from net radiation (), aerodynamic resistance (ra), the Bowen ratio (β for the IBM method) or surface resistance (rs for the TRM method), and heat storage G.
