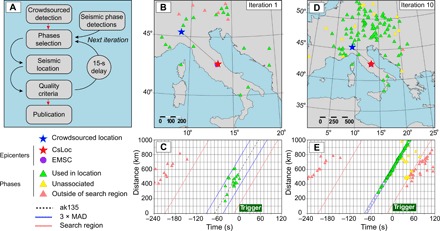
Fig. 2. The CsLoc procedure.

(A) Flowchart of the CsLoc association and location process. (B) First iteration of a typical CsLoc analysis. Fast-arriving Pn-phases up to 10° from the initial crowdsourced location are considered in the association process. (C) Phases within three times the median absolute deviation (MAD) are used for the iLoc location analysis. (D and E) The location process typically obtains a stable solution in less than 10 iterations. By the 10th iteration, more phases have arrived and the arrival times are highly aligned on the predicted Pn travel-time curve. Consequently, many more stations contribute to the location (note that the EMSC-published epicenter is hidden by the CsLoc epicenter).
