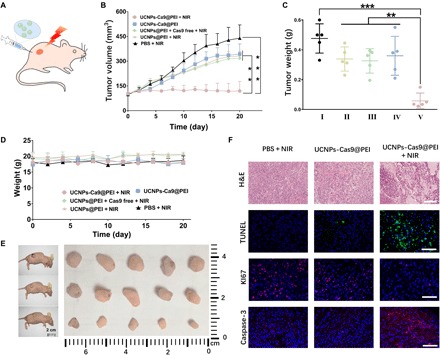
Fig. 5. The drug administration in a xenograft model of A549 cells.

(A) Schematic diagram of the working mechanism of remote-controlled oncotherapy in vivo. (B) Tumor sizes after different treatments, as indicated. (C) Weights of tumors treated by (I) PBS + NIR, (II) UCNPs@PEI + NIR, (III) UCNPs@PEI + Cas9 free + NIR, (IV) UCNPs-Cas9@PEI, and (V) UCNPs-Cas9@PEI + NIR (from left to right). (D) Changes in mouse body weight after different treatments, as indicated. (E) Images of tumor with PBS + NIR (top row), UCNPs-Cas9@PEI without light (middle row), and UCNPs-Cas9@PEI + NIR (bottom row). (F) H&E staining (scale bar, 200 μm), TUNEL (terminal deoxynucleotidyl transferase–mediated deoxyuridine triphosphate nick end labeling) staining (scale bar, 100 μm), KI67 antigen staining (scale bar, 100 μm), and caspase-3 staining (scale bar, 100 μm) of tumor tissues. The mean value was analyzed using t test (n = 5). **P < 0.01 represents significant difference and ***P < 0.001 represents highly significant difference.
