. 2019 Feb 25;8:e42535. doi: 10.7554/eLife.42535

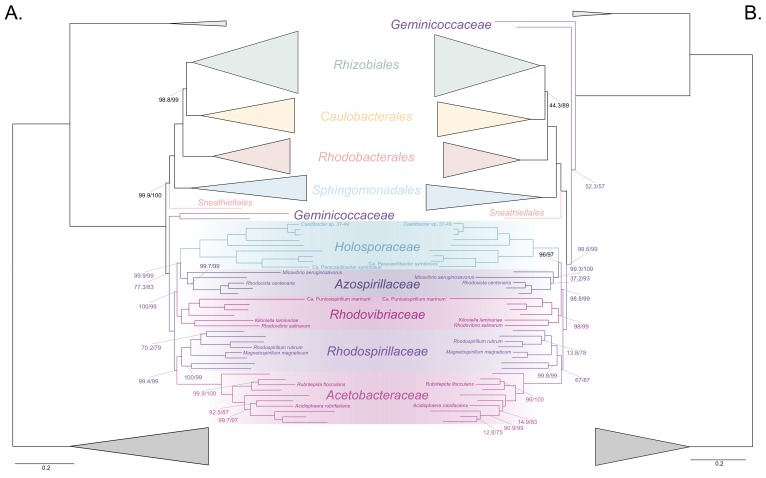
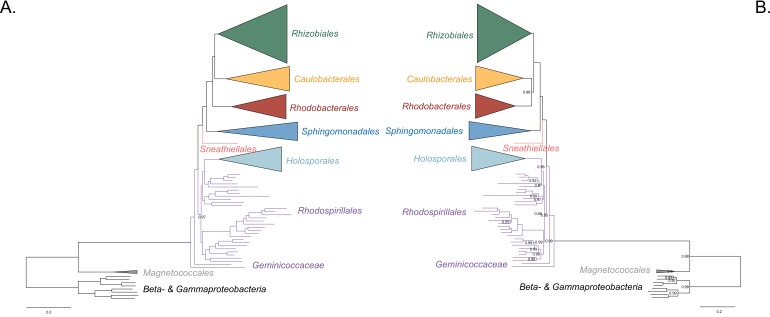
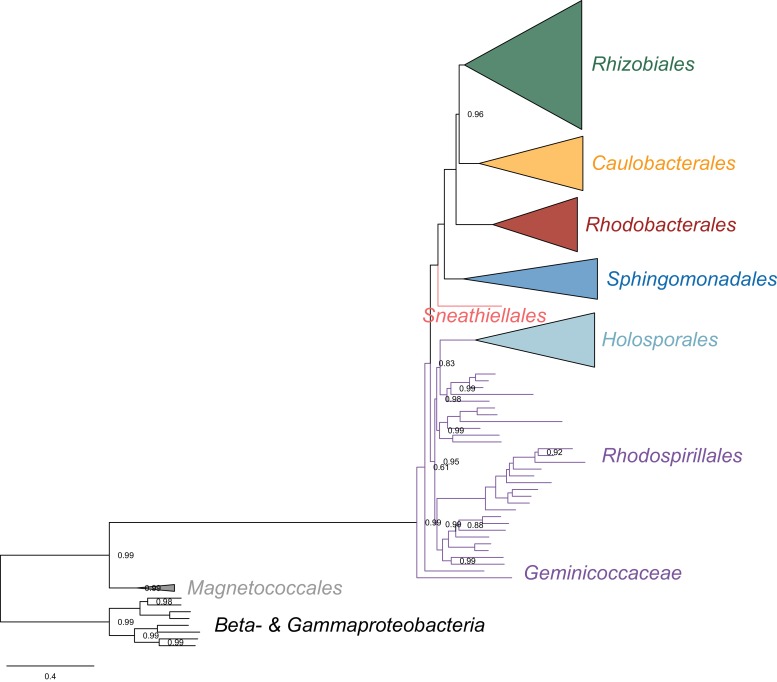
Figure 3. The Holosporales (renamed and lowered in rank to the Holosporaceae family here) branches in a derived position within the Rhodospirillales when compositional heterogeneity is reduced and the long-branched and compositionally biased Rickettsiales, Pelagibacterales, and alphaproteobacterium HIMB59 are removed.

Branch support values are 100% SH-aLRT and 100% UFBoot unless annotated. (A) A maximum-likelihood tree, inferred under the LG + PMSF(ES60)+F + R6 model, to place the Holosporaceae in the absence of the Rickettsiales, Pelagibacterales, and alphaproteobacterium HIMB59 and when compositional heterogeneity has been decreased by removing 50% of the most biased sites. The Holosporaceae is sister to the Azospirillaceae fam. nov. within the Rhodospirillales. (B) A maximum-likelihood tree, inferred under the GTR + ES60 S4+F + R6 model, to place the Holosporaceae in the absence of the Rickettsiales, Pelagibacterales, and alphaproteobacterium HIMB59, and when the data have been recoded into a four-character state alphabet (the dataset-specific recoding scheme S4: ARNDQEILKSTV GHY CMFP W) to reduce compositional heterogeneity. This phylogeny shows a pattern that matches that inferred when compositional heterogeneity has been alleviated through site removal. See Figure 3—figure supplement 6 for the Bayesian consensus trees inferred in PhyloBayes MPI v1.7 and under the and the CAT-Poisson+Γ4 model. See also Figure 3—figure supplements 15 and 78.

Figure 3.

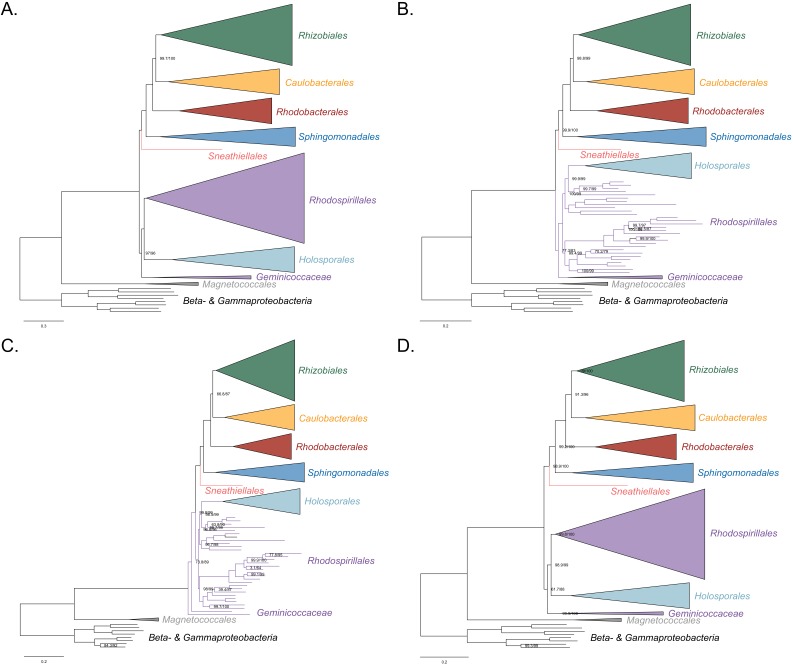
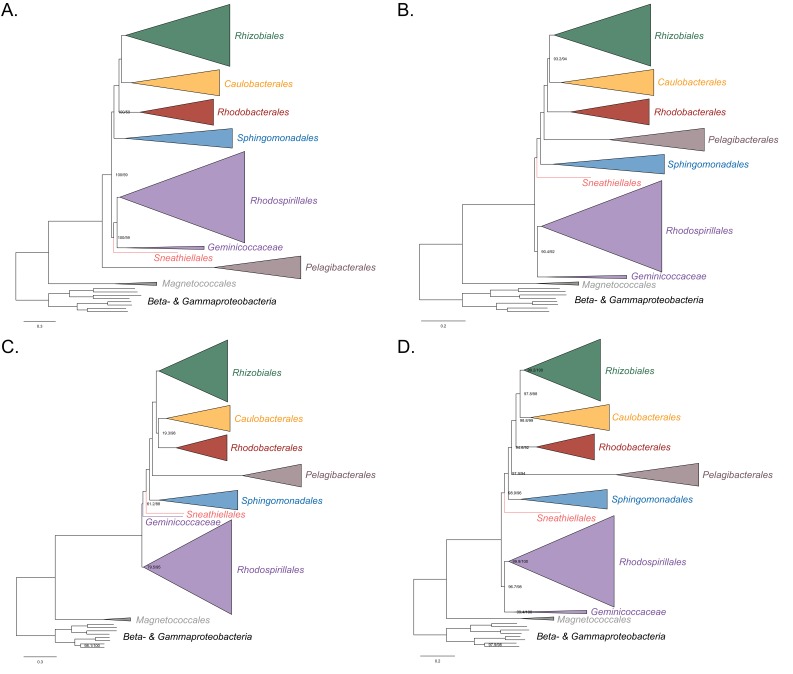
Figure 3—figure supplement 1. Maximum-likelihood trees to assess the placement of the Holosporales in the absence of the Rickettsiales, Pelagibacterales and alphaproteobacterium HIMB59.

Figure 3—figure supplement 1.

Branch support values are 100% SH-aLRT and 100% UFBoot unless annotated. (A) A tree that results from the analysis of the untreated dataset. () A tree that results from the analysis of a dataset from which the 50% most compositionally biased sites have been removed. (C) A tree that results from the analysis of a dataset that has been recoded into the four-character state recoding scheme S4 (recoding scheme: ARNDQEILKSTV GHY CMFP W). (D) A tree that results from the analysis of a dataset that only comprises the 40 most compositionally homogeneous genes.
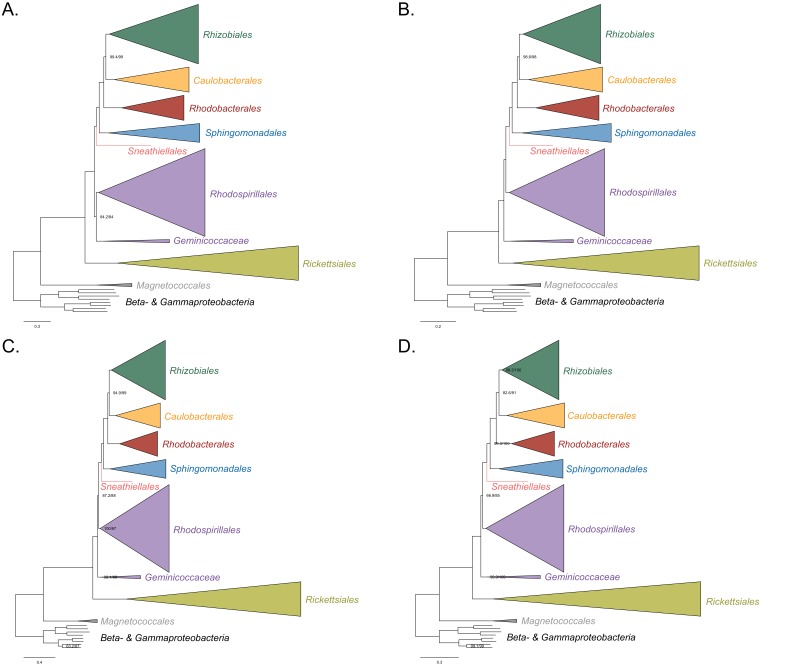
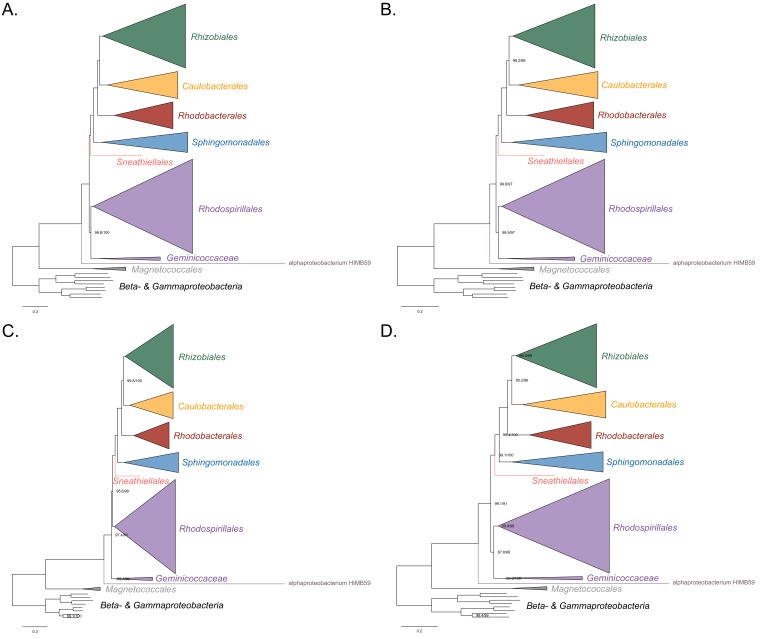
Figure 3—figure supplement 2. Maximum-likelihood trees to assess the placement of the Rickettsiales in the absence of the Holosporales, Pelagibacterales, and alphaproteobacterium HIMB59.

Figure 3—figure supplement 2.

Branch support values are 100% SH-aLRT and 100% UFBoot unless annotated. (A) A tree that results from the analysis of the untreated dataset. (B) A tree that results from the analysis of a dataset from which the 50% most compositionally biased sites have been removed. (C) A tree that results from the analysis of a dataset that has been recoded into the four-character state recoding scheme S4 (recoding scheme: PY RNMF GHLKTW ADCQEISV). (D) A tree that results from the analysis of a dataset that only comprises the 40 most compositionally homogeneous genes.
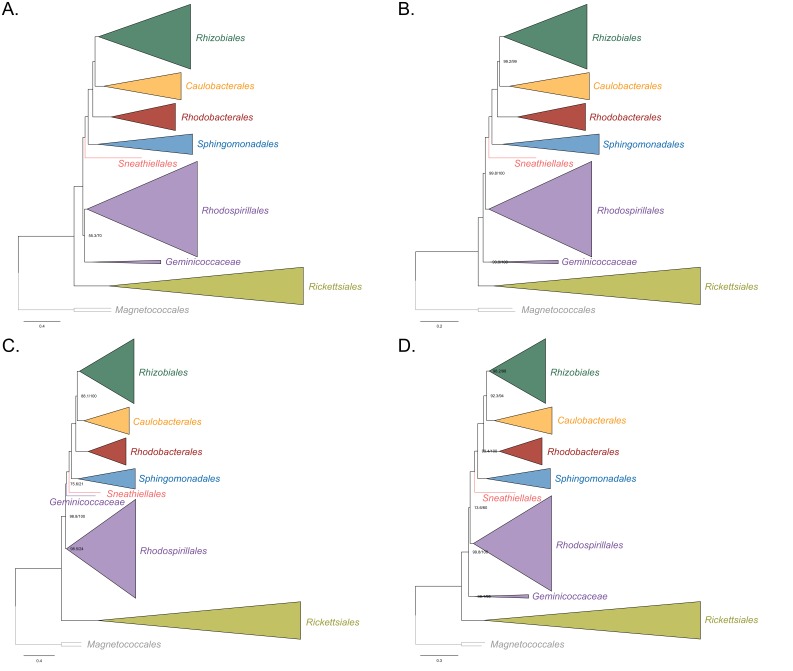
Figure 3—figure supplement 3. Maximum-likelihood trees to assess the placement of the Rickettsiales in the absence of the Holosporales, Pelagibacterales, alphaproteobacterium HIMB59 and the Beta-, and Gammaproteobacteria outgroup.

Figure 3—figure supplement 3.

Branch support values are 100% SH-aLRT and 100% UFBoot unless annotated. (A) A tree that results from the analysis of the untreated dataset. (B) A tree that results from the analysis of a dataset from which the 50% most compositionally biased sites have been removed. (C) A tree that results from the analysis of a dataset that has been recoded into the four-character state recoding scheme S4 (recoding scheme: RNMF GHLKTW ADCQEISV PY). (D) A tree that results from the analysis of a dataset that only comprises the 40 most compositionally homogeneous genes. Branch support values are 100% SH-aLRT and 100% UFBoot unless annotated.
Figure 3—figure supplement 4. Maximum-likelihood trees to assess the placement of the Pelagibacterales in the absence of the Holosporales, Rickettsiales and alphaproteobacterium HIMB59.

Figure 3—figure supplement 4.

Branch support values are 100% SH-aLRT and 100% UFBoot unless annotated. (A) A tree that results from the analysis of the untreated dataset. (B) A tree that results from the analysis of a dataset from which the 50% most compositionally biased sites have been removed. (C) A tree that results from the analysis of a dataset that has been recoded into the four-character state recoding scheme S4 (recoding scheme: EGIV ARNDQHKMPSY LFT CW). (D) A tree that results from the analysis of a dataset that only comprises the 40 most compositionally homogeneous genes.
Figure 3—figure supplement 5. Maximum-likelihood trees to assess the placement of alphaproteobacterium HIMB59 in the absence of the Holosporales, Rickettsiales and Pelagibacterales.

Figure 3—figure supplement 5.

Branch support values are 100% SH-aLRT and 100% UFBoot unless annotated.( A) A tree that results from the analysis of the untreated dataset. (B) A tree that results from the analysis of a dataset from which the 50% most compositionally biased sites have been removed. (C) A tree that results from the analysis of a dataset that has been recoded into the four-character state recoding scheme S4 (recoding scheme: RLKMT ANDQEIPSV CW GHFY). (D) A tree that results from the analysis of a dataset that only comprises the 40 most compositionally homogeneous genes.
Figure 3—figure supplement 6. Bayesian consensus trees inferred with PhyloBayes MPI v1.7 and the CAT-Poisson+Γ4 model.

Figure 3—figure supplement 6.

Branch support values are 1.0 posterior probabilities unless annotated. (A) Bayesian consensus tree inferred to place the Holosporales in the absence of the Rickettsiales and the Pelagibacterales and when compositional heterogeneity has been decreased by removing 50% of the most biased sites according to ɀ. (B) Bayesian consensus tree inferred to place the Holosporales in the absence of the Rickettsiales and the Pelagibacterales and when the data have been recoded into a four-character state alphabet (the dataset-specific recoding scheme S4: ARNDQEILKSTV GHY CMFP W) to reduce compositional heterogeneity. See Figure 2A and B for the most likely trees inferred in IQ-TREE v1.5.5 and the LG + PMSF(C60)+F + R6 and GTR + ES60 S4+F + R6 models, respectively.
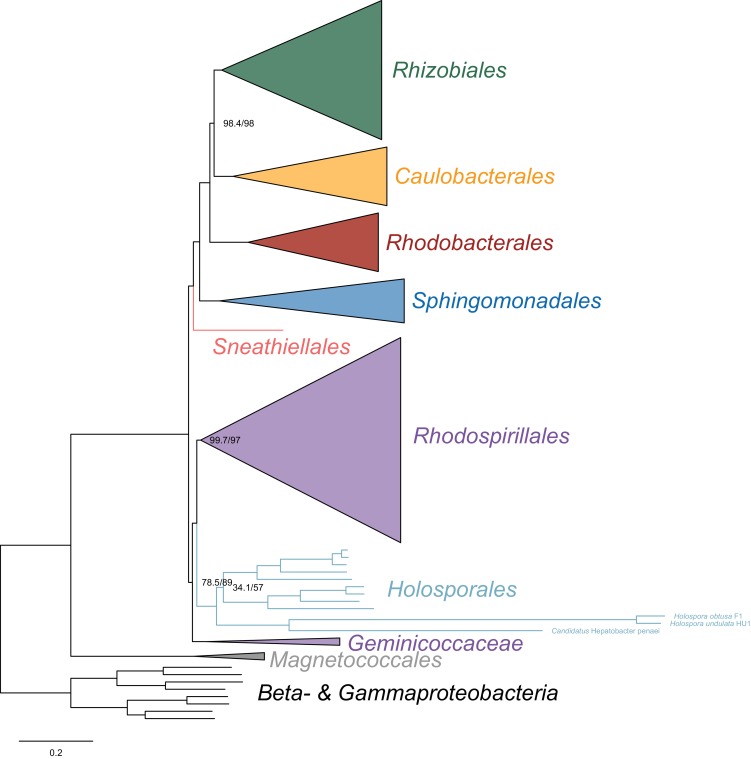
Figure 3—figure supplement 7. Maximum-likelihood trees to assess the placement of the Holosporales when the fast-evolving Holospora and ‘Candidatus Hepatobacter’ are also included in the absence of the Rickettsiales, Pelagibacterales and alphaproteobacterium HIMB59.

Figure 3—figure supplement 7.

Branch support values are 100% SH-aLRT and 100% UFBoot unless annotated.
Figure 3—figure supplement 8. Bayesian consensus tree inferred to place the Holosporales in the absence of the Pelagibacterales, alphaproteobacterium HIMB59, and Rickettsiales, and when the data have been recoded into a six-character state alphabet (the dataset-specific recoding scheme S6: AQEHISV RKMT PY DCLF NG W) to reduce compositional heterogeneity.

Figure 3—figure supplement 8.

Branch support values are 1.0 posterior probabilities unless annotated.