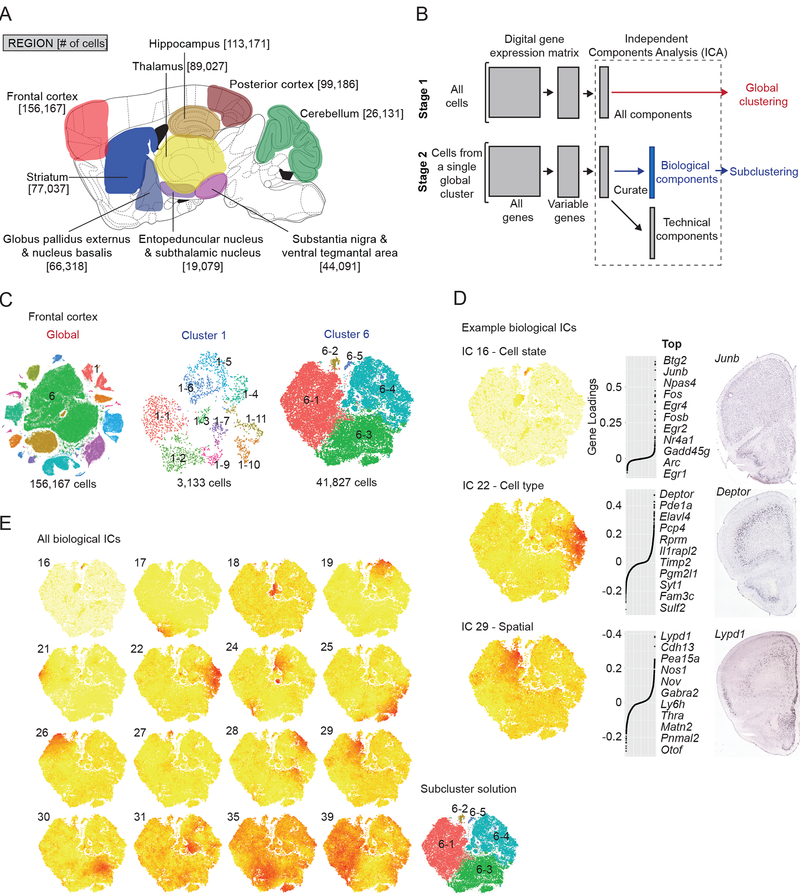
Figure 1. Single-cell transcriptional profiling of the adult mouse brain using Drop-seq and identification of transcriptional programs with independent component analysis.
(A) Sagittal schematic illustrating profiled brain regions and numbers of cells sampled (anatomical detail in Data S1). (B) Workflow for semi-supervised Independent Components Analysis (ICA)-based signal extraction and clustering (STAR Methods). In stage 1, the DGE matrix is clustered into cell classes (Figure S1) using ICA (“global clustering”). In stage 2 (“subclustering”), the process is repeated for each individual cluster from stage 1. In stage 2, however, the resulting ICs are curated as “technical” or “biological” with only “biological” ICs used as input for subclustering. (Figure S2) (C) tSNE plots for frontal cortex global clustering (left) and two representative subclusterings, GABAergic interneurons (cluster 1) and glutamatergic layer 2/3 and a subset of layer 5 neurons (cluster 6). (D) Examples of heterogeneous “Biological” ICs from frontal cortex cluster 6, representing a cell state (top, IC 16), cell type (middle, IC 22), and spatial anatomical signal (bottom, IC 29). For each example, a cell-loading tSNE plot, gene loading plot, and in situ hybridization experiment (Allen Mouse Brain Atlas, “Allen”) for a top-loading gene are shown from left to right. IC 16 corresponds to the immediate early gene signal. The IC 22 signal originates from layer 5a glutamatergic neurons, as suggested by Deptor expression. IC 29 represents a spatial signal, evidenced by a medial to lateral gradient of Lypd1. (E) Correspondence between heterogeneous transcriptional signals (biological ICs) and subclusters identified by modularity-based clustering (STAR Methods). Cell loadings for Biological ICs from frontal cortex cluster 6 and the resulting n=5 subclusters identified. Alternative subcluster solutions are shown in Figure S2K.

